Monessen SnackAbility
Overall SnackAbility
Cost of living in Monessen summary. We use data on the cost of living to determine how expensive it is to live in Monessen. Real estate prices drive most of the variance in cost of living around Pennsylvania. Key points include:
The cost of living in Monessen is 85 with 100 being average.
The cost of living in Monessen is 0.8x lower than the national average.
The median home value in Monessen is $80,828.
The median income in Monessen is $52,889.
Monessen's Overall Cost Of Living
Lower Than The National Average
Cost Of Living In Monessen Comparison Table
| Living Expense | Monessen | Pennsylvania | National Average |
|---|---|---|---|
| Overall | 85 | 97 | 100 |
| Services | 101 | 99 | 100 |
| Groceries | 97 | 100 | 100 |
| Health | 47 | 88 | 100 |
| Housing | 96 | 102 | 100 |
| Transportation | 97 | 100 | 100 |
| Utilities | 98 | 101 | 100 |
Source: Cost of living index, normalized to US average = 100
Monessen, PA Weather
The average high in Monessen is 62.4° and the average low is 40.8°.
There are 86.3 days of precipitation each year.
Expect an average of 38.8 inches of precipitation each year with 16.0 inches of snow.
| Stat | Monessen |
|---|---|
| Average Annual High | 62.4 |
| Average Annual Low | 40.8 |
| Annual Precipitation Days | 86.3 |
| Average Annual Precipitation | 38.8 |
| Average Annual Snowfall | 16.0 |
Average High
Days of Rain
Source: NOAA climate normals (30-year)
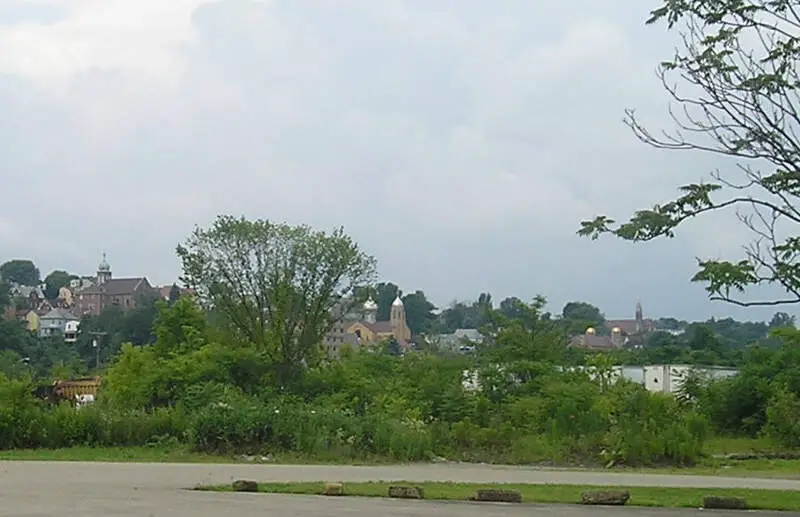
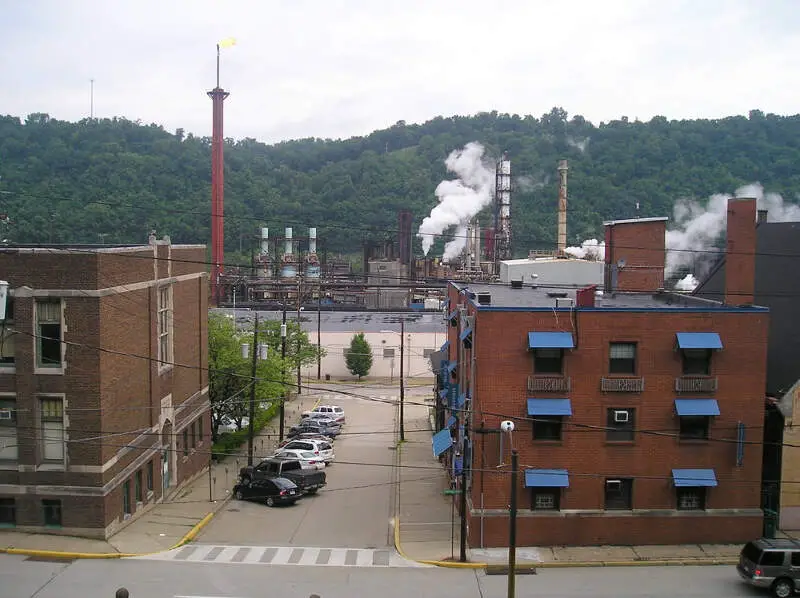
Monessen, PA Photos
Rankings & Articles For Monessen


Locations Around Monessen
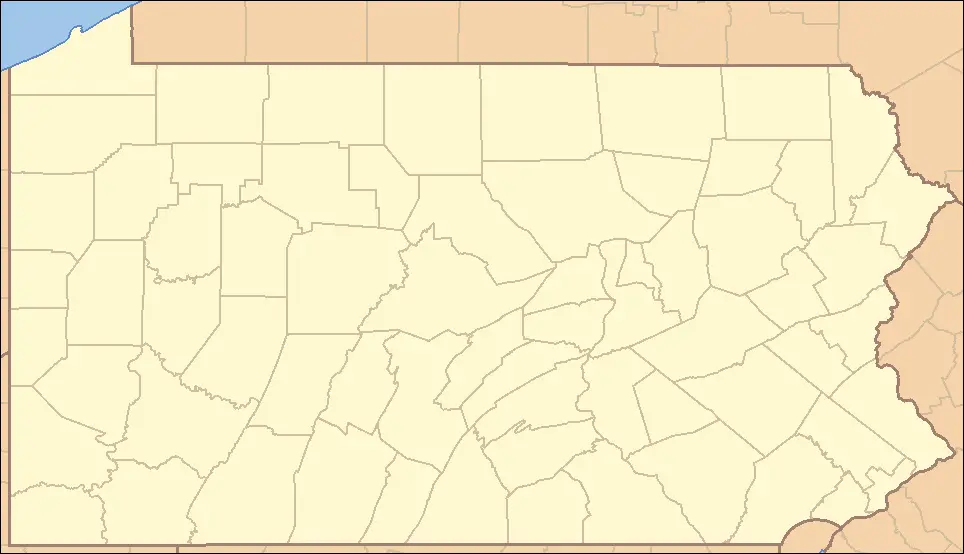
Map Of Monessen, PA
Best Places Around Monessen
Pleasant Hills, PA
Population 8,399
Forest Hills, PA
Population 6,286
Dormont, PA
Population 8,063
Castle Shannon, PA
Population 8,209
Whitehall, PA
Population 14,811
Baldwin, PA
Population 21,057
Brentwood, PA
Population 9,866
Jefferson Hills, PA
Population 12,317
Monessen Demographics And Statistics
Population over time in Monessen
The current population in Monessen is 6,780. The population has decreased 13.8% from 2010.
| Year | Population | % Change |
|---|---|---|
| 2024 | 6,780 | -0.7% |
| 2023 | 6,825 | -0.7% |
| 2022 | 6,876 | -0.9% |
| 2021 | 6,941 | -4.7% |
| 2020 | 7,287 | -0.8% |
| 2019 | 7,344 | -0.7% |
| 2018 | 7,397 | -1.0% |
| 2017 | 7,474 | -0.7% |
| 2016 | 7,530 | -0.7% |
| 2015 | 7,584 | -0.6% |
| 2014 | 7,630 | -0.7% |
| 2013 | 7,682 | -0.6% |
| 2012 | 7,732 | -1.1% |
| 2011 | 7,817 | -0.6% |
| 2010 | 7,863 | - |
Race / Ethnicity in Monessen
See the full breakdown
Monessen is:
72.2% White with 4,892 White residents.
18.8% African American with 1,273 African American residents.
0.1% American Indian with 5 American Indian residents.
0.4% Asian with 26 Asian residents.
0.0% Hawaiian with 0 Hawaiian residents.
1.3% Other with 90 Other residents.
5.0% Two Or More with 339 Two Or More residents.
2.3% Hispanic with 155 Hispanic residents.
| Race | Monessen | PA | USA |
|---|---|---|---|
| White | 72.2% | 73.0% | 57.4% |
| African American | 18.8% | 10.3% | 11.9% |
| American Indian | 0.1% | 0.1% | 0.5% |
| Asian | 0.4% | 3.8% | 5.9% |
| Hawaiian | 0.0% | 0.0% | 0.2% |
| Other | 1.3% | 0.5% | 0.6% |
| Two Or More | 5.0% | 3.6% | 4.3% |
| Hispanic | 2.3% | 8.7% | 19.3% |
Gender in Monessen
See the full breakdown
Monessen is 53.3% female with 3,617 female residents.
Monessen is 46.7% male with 3,163 male residents.
| Gender | Monessen | PA | USA |
|---|---|---|---|
| Female | 53.3% | 50.7% | 50.5% |
| Male | 46.7% | 49.3% | 49.5% |
Highest level of educational attainment in Monessen for adults over 25
See the full breakdown
1.0% of adults in Monessen completed < 9th grade.
6.0% of adults in Monessen completed 9-12th grade.
41.0% of adults in Monessen completed high school / ged.
15.0% of adults in Monessen completed some college.
11.0% of adults in Monessen completed associate's degree.
18.0% of adults in Monessen completed bachelor's degree.
6.0% of adults in Monessen completed master's degree.
0.0% of adults in Monessen completed professional degree.
2.0% of adults in Monessen completed doctorate degree.
| Education | Monessen | PA | USA |
|---|---|---|---|
| < 9th Grade | 1.0% | 3.0% | 4.0% |
| 9-12th Grade | 6.0% | 5.0% | 6.0% |
| High School / GED | 41.0% | 33.0% | 26.0% |
| Some College | 15.0% | 15.0% | 19.0% |
| Associate's Degree | 11.0% | 9.0% | 9.0% |
| Bachelor's Degree | 18.0% | 21.0% | 22.0% |
| Master's Degree | 6.0% | 10.0% | 10.0% |
| Professional Degree | 0.0% | 2.0% | 2.0% |
| Doctorate Degree | 2.0% | 2.0% | 2.0% |
Household Income For Monessen, Pennsylvania
See the full breakdown
12.0% of households in Monessen earn Less than $10,000.
3.8% of households in Monessen earn $10,000 to $14,999.
11.2% of households in Monessen earn $15,000 to $24,999.
8.2% of households in Monessen earn $25,000 to $34,999.
13.8% of households in Monessen earn $35,000 to $49,999.
14.7% of households in Monessen earn $50,000 to $74,999.
12.7% of households in Monessen earn $75,000 to $99,999.
13.7% of households in Monessen earn $100,000 to $149,999.
7.1% of households in Monessen earn $150,000 to $199,999.
2.9% of households in Monessen earn $200,000 or more.
| Income | Monessen | PA | USA |
|---|---|---|---|
| Less than $10,000 | 12.0% | 4.9% | 5.0% |
| $10,000 to $14,999 | 3.8% | 3.5% | 3.4% |
| $15,000 to $24,999 | 11.2% | 6.7% | 6.3% |
| $25,000 to $34,999 | 8.2% | 6.9% | 6.6% |
| $35,000 to $49,999 | 13.8% | 10.5% | 10.1% |
| $50,000 to $74,999 | 14.7% | 15.9% | 15.5% |
| $75,000 to $99,999 | 12.7% | 12.8% | 12.6% |
| $100,000 to $149,999 | 13.7% | 17.7% | 17.5% |
| $150,000 to $199,999 | 7.1% | 9.3% | 9.6% |
| $200,000 or more | 2.9% | 11.8% | 13.4% |
Source: U.S. Census ACS 5-year estimates (2024)


