Nanticoke SnackAbility
Overall SnackAbility
Cost of living in Nanticoke summary. We use data on the cost of living to determine how expensive it is to live in Nanticoke. Real estate prices drive most of the variance in cost of living around Pennsylvania. Key points include:
The cost of living in Nanticoke is 87 with 100 being average.
The cost of living in Nanticoke is 0.9x lower than the national average.
The median home value in Nanticoke is $164,941.
The median income in Nanticoke is $57,462.
Nanticoke's Overall Cost Of Living
Lower Than The National Average
Cost Of Living In Nanticoke Comparison Table
| Living Expense | Nanticoke | Pennsylvania | National Average |
|---|---|---|---|
| Overall | 87 | 97 | 100 |
| Services | 99 | 99 | 100 |
| Groceries | 98 | 100 | 100 |
| Health | 52 | 88 | 100 |
| Housing | 99 | 102 | 100 |
| Transportation | 103 | 100 | 100 |
| Utilities | 102 | 101 | 100 |
Source: Cost of living index, normalized to US average = 100
Nanticoke, PA Weather
The average high in Nanticoke is 60.4° and the average low is 39.5°.
There are 85.0 days of precipitation each year.
Expect an average of 42.0 inches of precipitation each year with 35.4 inches of snow.
| Stat | Nanticoke |
|---|---|
| Average Annual High | 60.4 |
| Average Annual Low | 39.5 |
| Annual Precipitation Days | 85.0 |
| Average Annual Precipitation | 42.0 |
| Average Annual Snowfall | 35.4 |
Average High
Days of Rain
Source: NOAA climate normals (30-year)
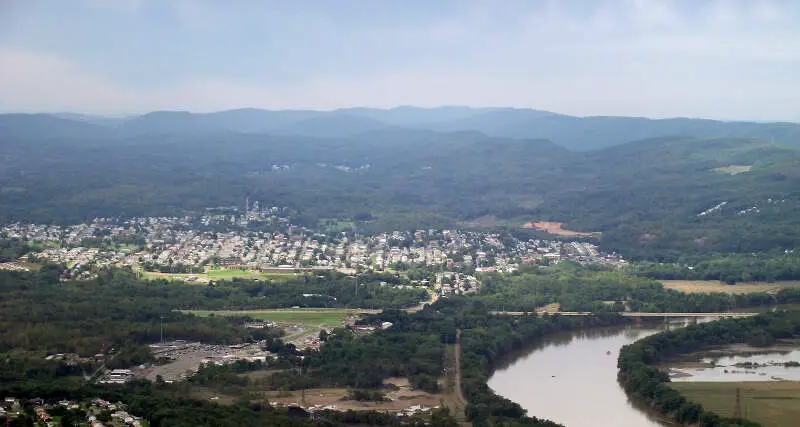
Nanticoke, PA Photos
1 Reviews & Comments About Nanticoke

This town is a cesspool of idiocy. A small town with nothing there. Those who accidentally find this place should leave as soon as possible. Sadly, there's not much there to stick around for.
There's almost no reason to go to this town. It's essentially a few churches, a giant cemetery, a burned down skating alley, a school, and a grocery store. Not much else there.
Rankings & Articles For Nanticoke


Locations Around Nanticoke
Map Of Nanticoke, PA
Best Places Around Nanticoke
Mountain Top, PA
Population 11,850
Old Forge, PA
Population 8,573
Kingston, PA
Population 13,397
Berwick, PA
Population 10,317
Swoyersville, PA
Population 5,048
Exeter, PA
Population 5,541
Moosic, PA
Population 5,973
Georgetown, SC
Population 8,565
Pittston, PA
Population 7,626
Plymouth, PA
Population 5,770
Nanticoke Demographics And Statistics
Population over time in Nanticoke
The current population in Nanticoke is 10,653. The population has increased 1.5% from 2010.
| Year | Population | % Change |
|---|---|---|
| 2024 | 10,653 | 0.4% |
| 2023 | 10,610 | 0.0% |
| 2022 | 10,606 | 0.2% |
| 2021 | 10,588 | 2.8% |
| 2020 | 10,296 | -0.1% |
| 2019 | 10,304 | 0.0% |
| 2018 | 10,302 | 0.1% |
| 2017 | 10,296 | -0.1% |
| 2016 | 10,302 | -0.5% |
| 2015 | 10,356 | -0.4% |
| 2014 | 10,395 | -0.5% |
| 2013 | 10,442 | -0.2% |
| 2012 | 10,459 | -0.2% |
| 2011 | 10,479 | -0.1% |
| 2010 | 10,492 | - |
Race / Ethnicity in Nanticoke
See the full breakdown
Nanticoke is:
77.6% White with 8,271 White residents.
9.0% African American with 964 African American residents.
0.0% American Indian with 0 American Indian residents.
0.0% Asian with 0 Asian residents.
0.0% Hawaiian with 0 Hawaiian residents.
0.1% Other with 12 Other residents.
2.3% Two Or More with 247 Two Or More residents.
10.9% Hispanic with 1,159 Hispanic residents.
| Race | Nanticoke | PA | USA |
|---|---|---|---|
| White | 77.6% | 73.0% | 57.4% |
| African American | 9.0% | 10.3% | 11.9% |
| American Indian | 0.0% | 0.1% | 0.5% |
| Asian | 0.0% | 3.8% | 5.9% |
| Hawaiian | 0.0% | 0.0% | 0.2% |
| Other | 0.1% | 0.5% | 0.6% |
| Two Or More | 2.3% | 3.6% | 4.3% |
| Hispanic | 10.9% | 8.7% | 19.3% |
Gender in Nanticoke
See the full breakdown
Nanticoke is 49.8% female with 5,308 female residents.
Nanticoke is 50.2% male with 5,344 male residents.
| Gender | Nanticoke | PA | USA |
|---|---|---|---|
| Female | 49.8% | 50.7% | 50.5% |
| Male | 50.2% | 49.3% | 49.5% |
Highest level of educational attainment in Nanticoke for adults over 25
See the full breakdown
4.0% of adults in Nanticoke completed < 9th grade.
10.0% of adults in Nanticoke completed 9-12th grade.
40.0% of adults in Nanticoke completed high school / ged.
17.0% of adults in Nanticoke completed some college.
10.0% of adults in Nanticoke completed associate's degree.
14.0% of adults in Nanticoke completed bachelor's degree.
4.0% of adults in Nanticoke completed master's degree.
0.0% of adults in Nanticoke completed professional degree.
1.0% of adults in Nanticoke completed doctorate degree.
| Education | Nanticoke | PA | USA |
|---|---|---|---|
| < 9th Grade | 4.0% | 3.0% | 4.0% |
| 9-12th Grade | 10.0% | 5.0% | 6.0% |
| High School / GED | 40.0% | 33.0% | 26.0% |
| Some College | 17.0% | 15.0% | 19.0% |
| Associate's Degree | 10.0% | 9.0% | 9.0% |
| Bachelor's Degree | 14.0% | 21.0% | 22.0% |
| Master's Degree | 4.0% | 10.0% | 10.0% |
| Professional Degree | 0.0% | 2.0% | 2.0% |
| Doctorate Degree | 1.0% | 2.0% | 2.0% |
Household Income For Nanticoke, Pennsylvania
See the full breakdown
8.4% of households in Nanticoke earn Less than $10,000.
6.8% of households in Nanticoke earn $10,000 to $14,999.
11.1% of households in Nanticoke earn $15,000 to $24,999.
5.9% of households in Nanticoke earn $25,000 to $34,999.
11.8% of households in Nanticoke earn $35,000 to $49,999.
19.0% of households in Nanticoke earn $50,000 to $74,999.
13.2% of households in Nanticoke earn $75,000 to $99,999.
17.7% of households in Nanticoke earn $100,000 to $149,999.
3.3% of households in Nanticoke earn $150,000 to $199,999.
2.9% of households in Nanticoke earn $200,000 or more.
| Income | Nanticoke | PA | USA |
|---|---|---|---|
| Less than $10,000 | 8.4% | 4.9% | 5.0% |
| $10,000 to $14,999 | 6.8% | 3.5% | 3.4% |
| $15,000 to $24,999 | 11.1% | 6.7% | 6.3% |
| $25,000 to $34,999 | 5.9% | 6.9% | 6.6% |
| $35,000 to $49,999 | 11.8% | 10.5% | 10.1% |
| $50,000 to $74,999 | 19.0% | 15.9% | 15.5% |
| $75,000 to $99,999 | 13.2% | 12.8% | 12.6% |
| $100,000 to $149,999 | 17.7% | 17.7% | 17.5% |
| $150,000 to $199,999 | 3.3% | 9.3% | 9.6% |
| $200,000 or more | 2.9% | 11.8% | 13.4% |
Source: U.S. Census ACS 5-year estimates (2024)


