Reading SnackAbility
Overall SnackAbility
Cost of living in Reading summary. We use data on the cost of living to determine how expensive it is to live in Reading. Real estate prices drive most of the variance in cost of living around Pennsylvania. Key points include:
The cost of living in Reading is 87 with 100 being average.
The cost of living in Reading is 0.9x lower than the national average.
The median home value in Reading is $260,653.
The median income in Reading is $44,091.
Reading's Overall Cost Of Living
Lower Than The National Average
Cost Of Living In Reading Comparison Table
| Living Expense | Reading | Pennsylvania | National Average |
|---|---|---|---|
| Overall | 87 | 97 | 100 |
| Services | 101 | 99 | 100 |
| Groceries | 100 | 100 | 100 |
| Health | 57 | 88 | 100 |
| Housing | 101 | 102 | 100 |
| Transportation | 100 | 100 | 100 |
| Utilities | 105 | 101 | 100 |
Source: Cost of living index, normalized to US average = 100
Reading, PA Weather
The average high in Reading is 62.4° and the average low is 43.0°.
There are 76.1 days of precipitation each year.
Expect an average of 43.6 inches of precipitation each year with 23.2 inches of snow.
| Stat | Reading |
|---|---|
| Average Annual High | 62.4 |
| Average Annual Low | 43.0 |
| Annual Precipitation Days | 76.1 |
| Average Annual Precipitation | 43.6 |
| Average Annual Snowfall | 23.2 |
Average High
Days of Rain
Source: NOAA climate normals (30-year)
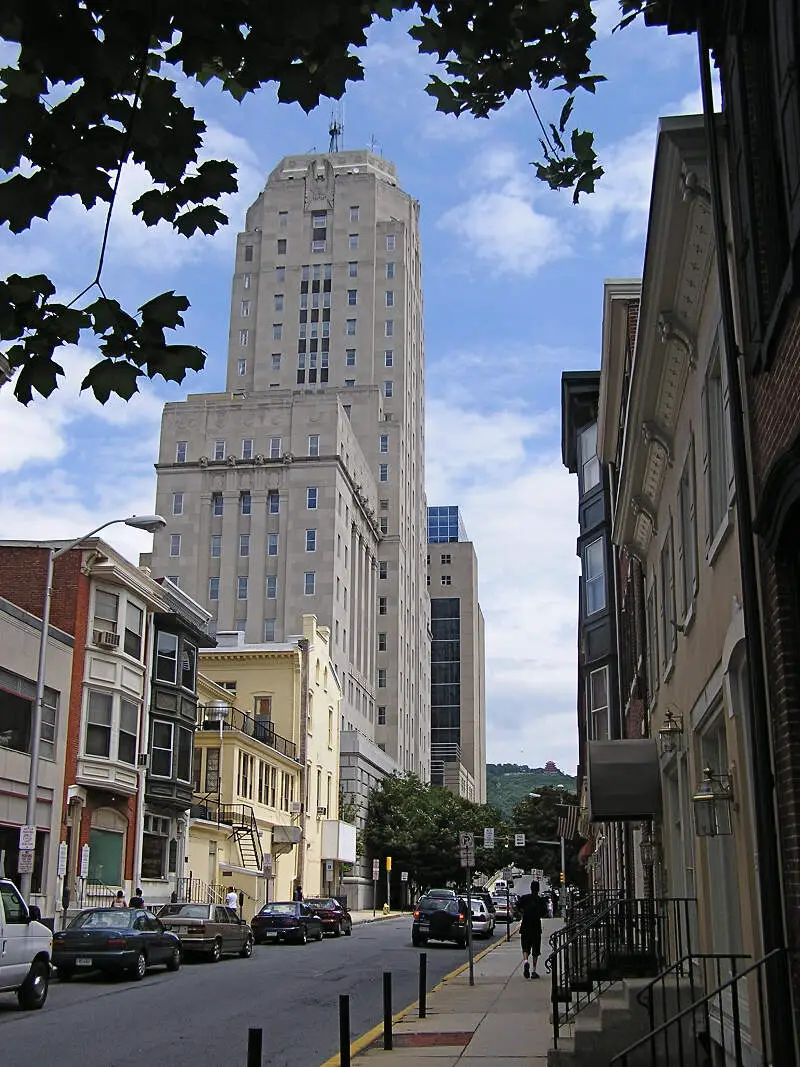
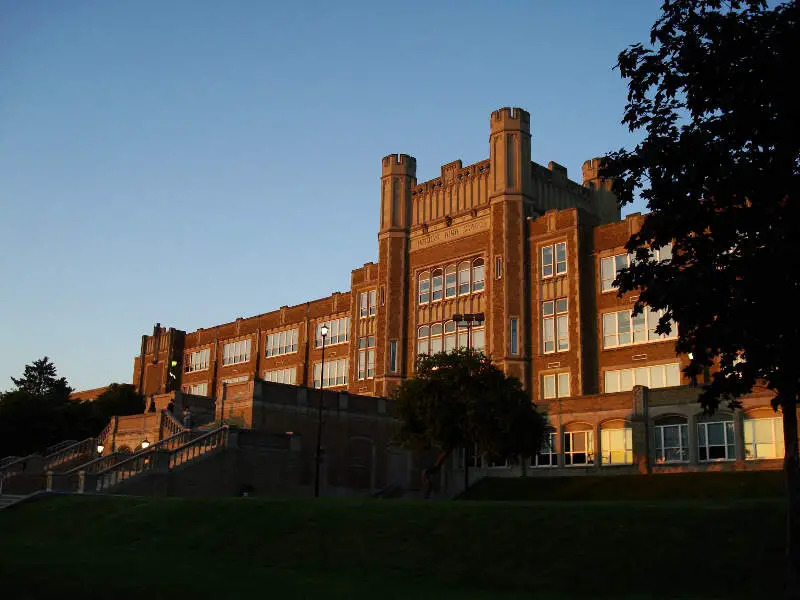
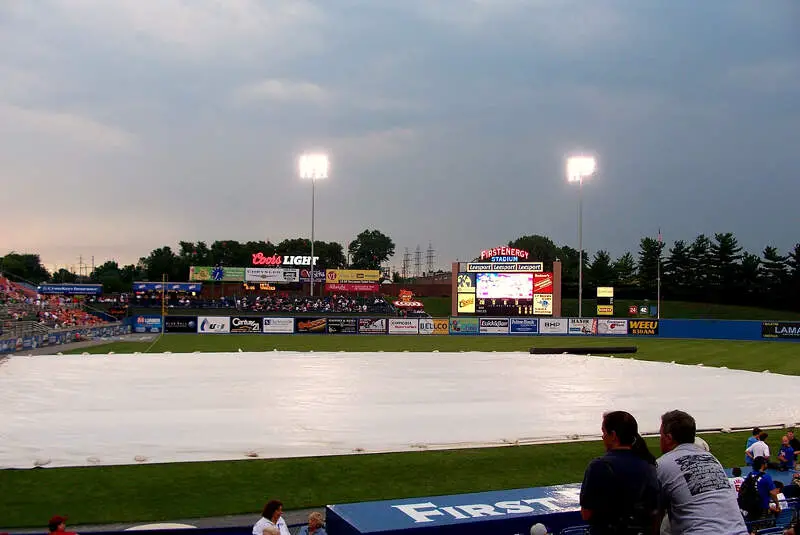
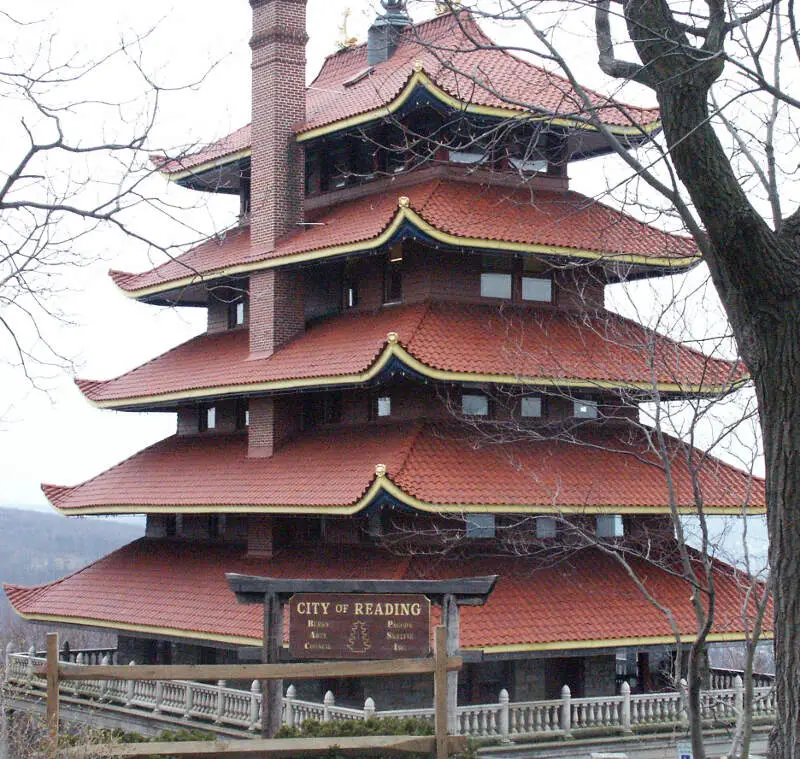
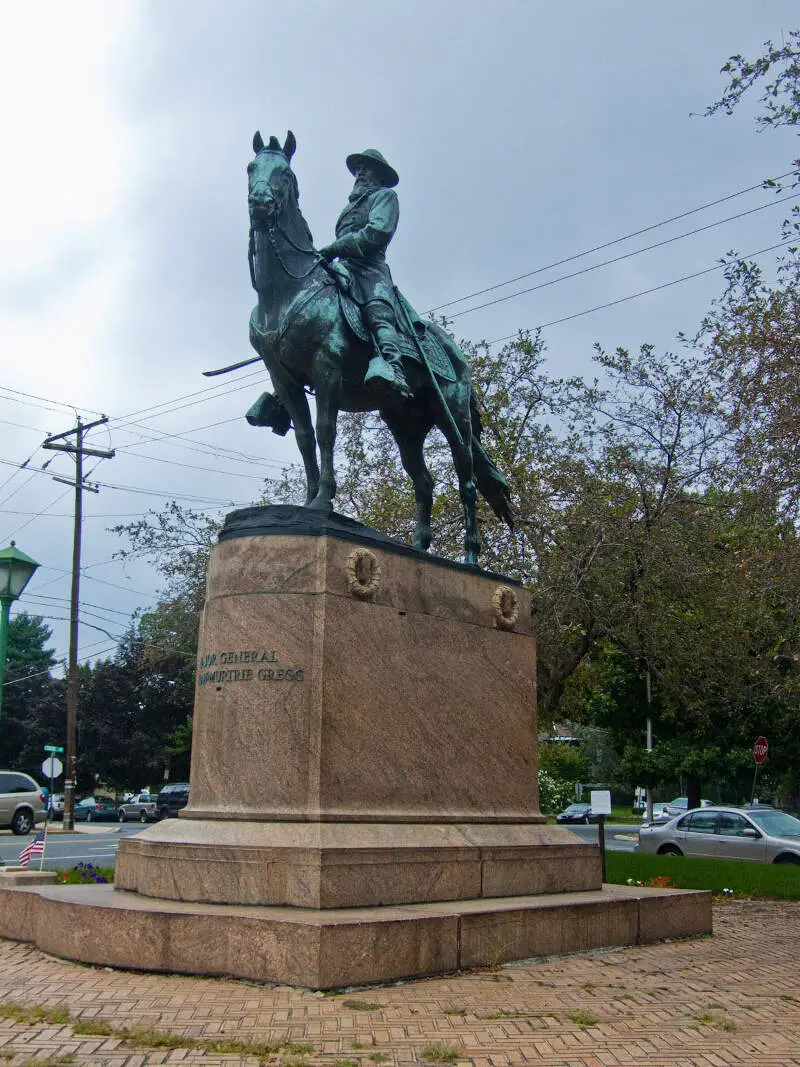
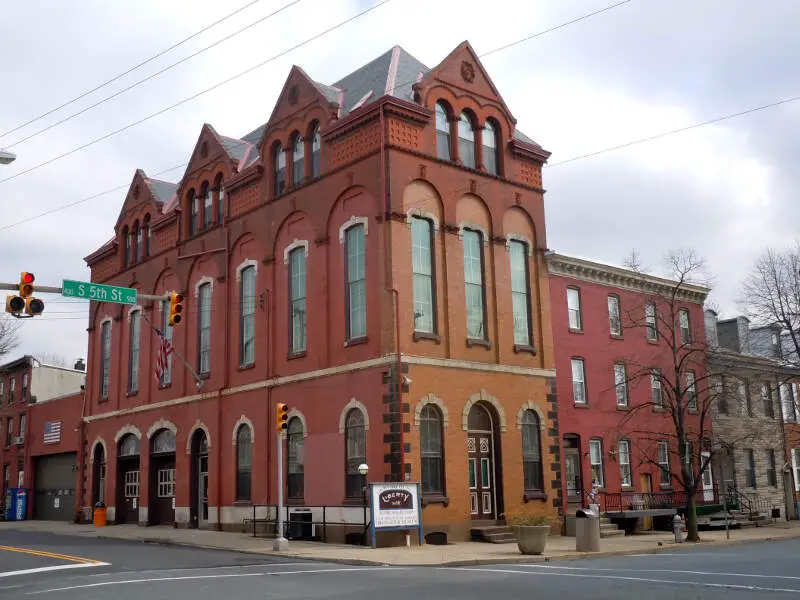
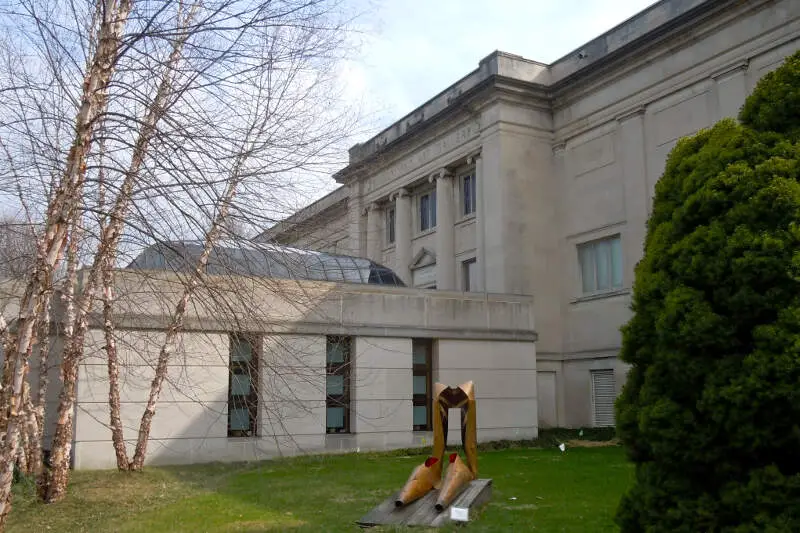
Reading, PA Photos


2 Reviews & Comments About Reading

I live in Reading PA,it's true that's it's poor,but instead of judging, we should make it better,we should start by not throwing the trash,on the street,and be more clean,instead of waiting for the government to help.
Shenandoah is a filthy blighted town. Crime rate is high. Drug arrests is common. Drug traffic is from reading, pa and NYC via latino community. Average home cost is 6000.00. there are so many abandoned homes.
Tamaqua- this is a charming town. Homes are kept up. Downtown area is busy and has businesses. They have invested a lot of money into this town.
I know.......I live near these areas
Rankings & Articles For Reading


Locations Around Reading
Map Of Reading, PA
Best Places Around Reading
Whitfield, PA
Population 5,226
Sanatoga, PA
Population 8,949
Blandon, PA
Population 7,357
Ephrata, PA
Population 13,772
New Holland, PA
Population 5,780
Shillington, PA
Population 5,492
Wyomissing, PA
Population 11,172
Birdsboro, PA
Population 5,116
Reading Demographics And Statistics
Population over time in Reading
The current population in Reading is 95,242. The population has increased 9.0% from 2010.
| Year | Population | % Change |
|---|---|---|
| 2024 | 95,242 | 0.4% |
| 2023 | 94,836 | 0.2% |
| 2022 | 94,601 | 0.5% |
| 2021 | 94,161 | 6.6% |
| 2020 | 88,333 | 0.1% |
| 2019 | 88,232 | 0.0% |
| 2018 | 88,211 | -0.1% |
| 2017 | 88,275 | 0.4% |
| 2016 | 87,899 | -0.2% |
| 2015 | 88,057 | 0.0% |
| 2014 | 88,051 | 0.1% |
| 2013 | 87,978 | 0.1% |
| 2012 | 87,926 | 0.1% |
| 2011 | 87,798 | 0.5% |
| 2010 | 87,404 | - |
Race / Ethnicity in Reading
See the full breakdown
Reading is:
18.5% White with 17,604 White residents.
7.7% African American with 7,312 African American residents.
0.0% American Indian with 15 American Indian residents.
0.5% Asian with 437 Asian residents.
0.0% Hawaiian with 0 Hawaiian residents.
0.5% Other with 504 Other residents.
2.1% Two Or More with 1,956 Two Or More residents.
70.8% Hispanic with 67,414 Hispanic residents.
| Race | Reading | PA | USA |
|---|---|---|---|
| White | 18.5% | 73.0% | 57.4% |
| African American | 7.7% | 10.3% | 11.9% |
| American Indian | 0.0% | 0.1% | 0.5% |
| Asian | 0.5% | 3.8% | 5.9% |
| Hawaiian | 0.0% | 0.0% | 0.2% |
| Other | 0.5% | 0.5% | 0.6% |
| Two Or More | 2.1% | 3.6% | 4.3% |
| Hispanic | 70.8% | 8.7% | 19.3% |
Gender in Reading
See the full breakdown
Reading is 51.9% female with 49,400 female residents.
Reading is 48.1% male with 45,842 male residents.
| Gender | Reading | PA | USA |
|---|---|---|---|
| Female | 51.9% | 50.7% | 50.5% |
| Male | 48.1% | 49.3% | 49.5% |
Highest level of educational attainment in Reading for adults over 25
See the full breakdown
14.0% of adults in Reading completed < 9th grade.
14.0% of adults in Reading completed 9-12th grade.
38.0% of adults in Reading completed high school / ged.
15.0% of adults in Reading completed some college.
7.0% of adults in Reading completed associate's degree.
8.0% of adults in Reading completed bachelor's degree.
3.0% of adults in Reading completed master's degree.
1.0% of adults in Reading completed professional degree.
0.0% of adults in Reading completed doctorate degree.
| Education | Reading | PA | USA |
|---|---|---|---|
| < 9th Grade | 14.0% | 3.0% | 4.0% |
| 9-12th Grade | 14.0% | 5.0% | 6.0% |
| High School / GED | 38.0% | 33.0% | 26.0% |
| Some College | 15.0% | 15.0% | 19.0% |
| Associate's Degree | 7.0% | 9.0% | 9.0% |
| Bachelor's Degree | 8.0% | 21.0% | 22.0% |
| Master's Degree | 3.0% | 10.0% | 10.0% |
| Professional Degree | 1.0% | 2.0% | 2.0% |
| Doctorate Degree | 0.0% | 2.0% | 2.0% |
Household Income For Reading, Pennsylvania
See the full breakdown
9.1% of households in Reading earn Less than $10,000.
7.6% of households in Reading earn $10,000 to $14,999.
13.1% of households in Reading earn $15,000 to $24,999.
11.8% of households in Reading earn $25,000 to $34,999.
12.6% of households in Reading earn $35,000 to $49,999.
18.0% of households in Reading earn $50,000 to $74,999.
11.7% of households in Reading earn $75,000 to $99,999.
10.2% of households in Reading earn $100,000 to $149,999.
3.2% of households in Reading earn $150,000 to $199,999.
2.7% of households in Reading earn $200,000 or more.
| Income | Reading | PA | USA |
|---|---|---|---|
| Less than $10,000 | 9.1% | 4.9% | 5.0% |
| $10,000 to $14,999 | 7.6% | 3.5% | 3.4% |
| $15,000 to $24,999 | 13.1% | 6.7% | 6.3% |
| $25,000 to $34,999 | 11.8% | 6.9% | 6.6% |
| $35,000 to $49,999 | 12.6% | 10.5% | 10.1% |
| $50,000 to $74,999 | 18.0% | 15.9% | 15.5% |
| $75,000 to $99,999 | 11.7% | 12.8% | 12.6% |
| $100,000 to $149,999 | 10.2% | 17.7% | 17.5% |
| $150,000 to $199,999 | 3.2% | 9.3% | 9.6% |
| $200,000 or more | 2.7% | 11.8% | 13.4% |
Source: U.S. Census ACS 5-year estimates (2024)


