Sharon, PA
Demographics And Statistics
Living In Sharon, Pennsylvania Summary
Life in Sharon research summary. HomeSnacks has been using Saturday Night Science to research the quality of life in Sharon over the past nine years using Census, FBI, Zillow, and other primary data sources. Based on the most recently available data, we found the following about life in Sharon:
The population in Sharon is 13,019.
The median home value in Sharon is $70,173.
The median income in Sharon is $44,595.
The cost of living in Sharon is 81 which is 0.8x lower than the national average.
The median rent in Sharon is $780.
The unemployment rate in Sharon is 9.0%.
The poverty rate in Sharon is 21.3%.
The average high in Sharon is 60.6° and the average low is 39.3°.
Table Of Contents
Sharon SnackAbility
Overall SnackAbility
Sharon, PA Cost Of Living
Cost of living in Sharon summary. We use data on the cost of living to determine how expensive it is to live in Sharon. Real estate prices drive most of the variance in cost of living around Pennsylvania. Key points include:
The cost of living in Sharon is 81 with 100 being average.
The cost of living in Sharon is 0.8x lower than the national average.
The median home value in Sharon is $70,173.
The median income in Sharon is $44,595.
Sharon's Overall Cost Of Living
Lower Than The National Average
Cost Of Living In Sharon Comparison Table
| Living Expense | Sharon | Pennsylvania | National Average | |
|---|---|---|---|---|
| Overall | 81 | 100 | 100 | |
| Services | 92 | 101 | 100 | |
| Groceries | 99 | 101 | 100 | |
| Health | 92 | 95 | 100 | |
| Housing | 44 | 93 | 100 | |
| Transportation | 109 | 108 | 100 | |
| Utilities | 123 | 108 | 100 | |
Sharon, PA Weather
The average high in Sharon is 60.6° and the average low is 39.3°.
There are 90.4 days of precipitation each year.
Expect an average of 38.4 inches of precipitation each year with 49.8 inches of snow.
| Stat | Sharon |
|---|---|
| Average Annual High | 60.6 |
| Average Annual Low | 39.3 |
| Annual Precipitation Days | 90.4 |
| Average Annual Precipitation | 38.4 |
| Average Annual Snowfall | 49.8 |
Average High
Days of Rain
Sharon, PA Photos
Rankings for Sharon in Pennsylvania


Locations Around Sharon
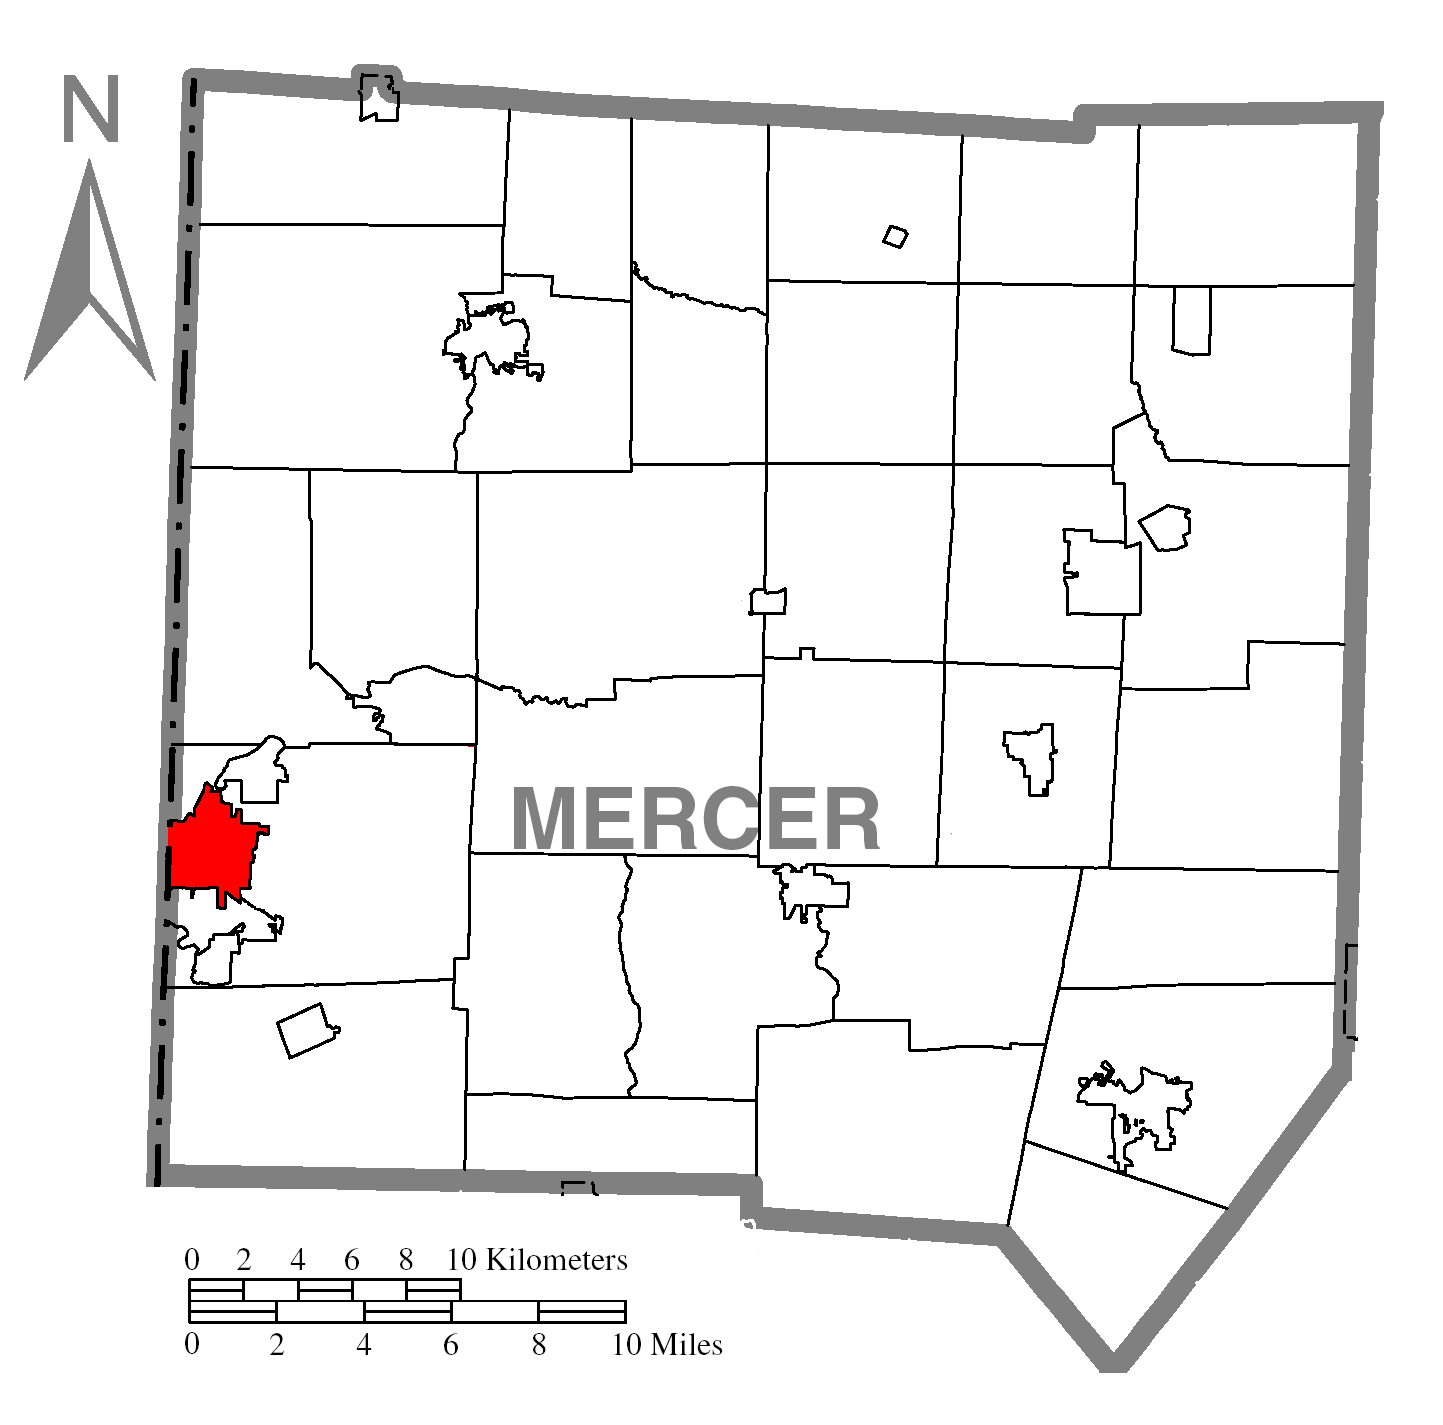
Map Of Sharon, PA
Best Places Around Sharon
Canfield, OH
Population 7,651
Howland Center, OH
Population 6,564
Cortland, OH
Population 7,091
Champion Heights, OH
Population 6,299
Austintown, OH
Population 30,215
Hubbard, OH
Population 7,600
Struthers, OH
Population 9,995
Campbell, OH
Population 7,812
Niles, OH
Population 18,301
Sharon Demographics And Statistics
Population over time in Sharon
The current population in Sharon is 13,019. The population has decreased -9.9% from 2010.
| Year | Population | % Change |
|---|---|---|
| 2023 | 13,019 | -0.9% |
| 2022 | 13,143 | -0.5% |
| 2021 | 13,203 | 0.8% |
| 2020 | 13,101 | -1.0% |
| 2019 | 13,227 | -1.1% |
| 2018 | 13,378 | -0.9% |
| 2017 | 13,505 | -1.1% |
| 2016 | 13,659 | -0.7% |
| 2015 | 13,754 | -0.7% |
| 2014 | 13,845 | -0.6% |
| 2013 | 13,930 | -0.9% |
| 2012 | 14,060 | -1.4% |
| 2011 | 14,263 | -1.3% |
| 2010 | 14,456 | - |
Race / Ethnicity in Sharon
Sharon is:
75.7% White with 9,853 White residents.
15.6% African American with 2,032 African American residents.
0.0% American Indian with 4 American Indian residents.
0.3% Asian with 38 Asian residents.
0.0% Hawaiian with 0 Hawaiian residents.
0.0% Other with 0 Other residents.
5.8% Two Or More with 758 Two Or More residents.
2.6% Hispanic with 334 Hispanic residents.
| Race | Sharon | PA | USA |
|---|---|---|---|
| White | 75.7% | 73.8% | 58.2% |
| African American | 15.6% | 10.3% | 12.0% |
| American Indian | 0.0% | 0.1% | 0.5% |
| Asian | 0.3% | 3.7% | 5.7% |
| Hawaiian | 0.0% | 0.0% | 0.2% |
| Other | 0.0% | 0.4% | 0.5% |
| Two Or More | 5.8% | 3.3% | 3.9% |
| Hispanic | 2.6% | 8.4% | 19.0% |
Gender in Sharon
Sharon is 50.0% female with 6,507 female residents.
Sharon is 50.0% male with 6,512 male residents.
| Gender | Sharon | PA | USA |
|---|---|---|---|
| Female | 50.0% | 50.7% | 50.5% |
| Male | 50.0% | 49.3% | 49.5% |
Highest level of educational attainment in Sharon for adults over 25
2.0% of adults in Sharon completed < 9th grade.
7.0% of adults in Sharon completed 9-12th grade.
43.0% of adults in Sharon completed high school / ged.
17.0% of adults in Sharon completed some college.
12.0% of adults in Sharon completed associate's degree.
12.0% of adults in Sharon completed bachelor's degree.
6.0% of adults in Sharon completed master's degree.
0.0% of adults in Sharon completed professional degree.
1.0% of adults in Sharon completed doctorate degree.
| Education | Sharon | PA | USA |
|---|---|---|---|
| < 9th Grade | 2.0% | 3.0% | 5.0% |
| 9-12th Grade | 7.0% | 5.0% | 6.0% |
| High School / GED | 43.0% | 33.0% | 26.0% |
| Some College | 17.0% | 15.0% | 19.0% |
| Associate's Degree | 12.0% | 9.0% | 9.0% |
| Bachelor's Degree | 12.0% | 21.0% | 21.0% |
| Master's Degree | 6.0% | 10.0% | 10.0% |
| Professional Degree | 0.0% | 2.0% | 2.0% |
| Doctorate Degree | 1.0% | 2.0% | 2.0% |
Household Income For Sharon, Pennsylvania
7.8% of households in Sharon earn Less than $10,000.
10.1% of households in Sharon earn $10,000 to $14,999.
13.7% of households in Sharon earn $15,000 to $24,999.
10.5% of households in Sharon earn $25,000 to $34,999.
12.5% of households in Sharon earn $35,000 to $49,999.
20.6% of households in Sharon earn $50,000 to $74,999.
7.9% of households in Sharon earn $75,000 to $99,999.
11.7% of households in Sharon earn $100,000 to $149,999.
3.4% of households in Sharon earn $150,000 to $199,999.
1.9% of households in Sharon earn $200,000 or more.
| Income | Sharon | PA | USA |
|---|---|---|---|
| Less than $10,000 | 7.8% | 4.8% | 4.9% |
| $10,000 to $14,999 | 10.1% | 3.7% | 3.6% |
| $15,000 to $24,999 | 13.7% | 7.0% | 6.6% |
| $25,000 to $34,999 | 10.5% | 7.1% | 6.8% |
| $35,000 to $49,999 | 12.5% | 10.7% | 10.4% |
| $50,000 to $74,999 | 20.6% | 16.1% | 15.7% |
| $75,000 to $99,999 | 7.9% | 12.9% | 12.7% |
| $100,000 to $149,999 | 11.7% | 17.6% | 17.4% |
| $150,000 to $199,999 | 3.4% | 9.0% | 9.3% |
| $200,000 or more | 1.9% | 11.1% | 12.6% |


