Titusville SnackAbility
Overall SnackAbility
Cost of living in Titusville summary. We use data on the cost of living to determine how expensive it is to live in Titusville. Real estate prices drive most of the variance in cost of living around Pennsylvania. Key points include:
The cost of living in Titusville is 83 with 100 being average.
The cost of living in Titusville is 0.8x lower than the national average.
The median home value in Titusville is $113,340.
The median income in Titusville is $38,194.
Titusville's Overall Cost Of Living
Lower Than The National Average
Cost Of Living In Titusville Comparison Table
| Living Expense | Titusville | Pennsylvania | National Average |
|---|---|---|---|
| Overall | 83 | 97 | 100 |
| Services | 95 | 99 | 100 |
| Groceries | 96 | 100 | 100 |
| Health | 44 | 88 | 100 |
| Housing | 101 | 102 | 100 |
| Transportation | 102 | 100 | 100 |
| Utilities | 94 | 101 | 100 |
Source: Cost of living index, normalized to US average = 100
Titusville, PA Weather
The average high in Titusville is 57.2° and the average low is 36.1°.
There are 101.1 days of precipitation each year.
Expect an average of 45.4 inches of precipitation each year with 81.6 inches of snow.
| Stat | Titusville |
|---|---|
| Average Annual High | 57.2 |
| Average Annual Low | 36.1 |
| Annual Precipitation Days | 101.1 |
| Average Annual Precipitation | 45.4 |
| Average Annual Snowfall | 81.6 |
Average High
Days of Rain
Source: NOAA climate normals (30-year)
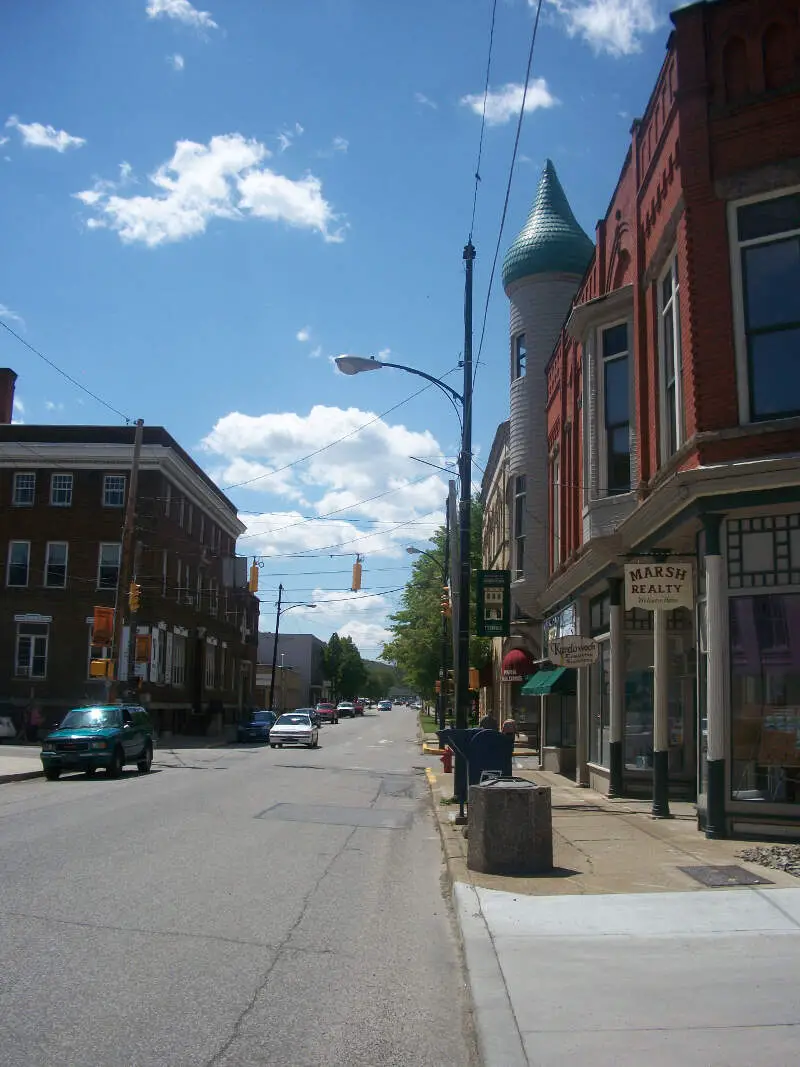
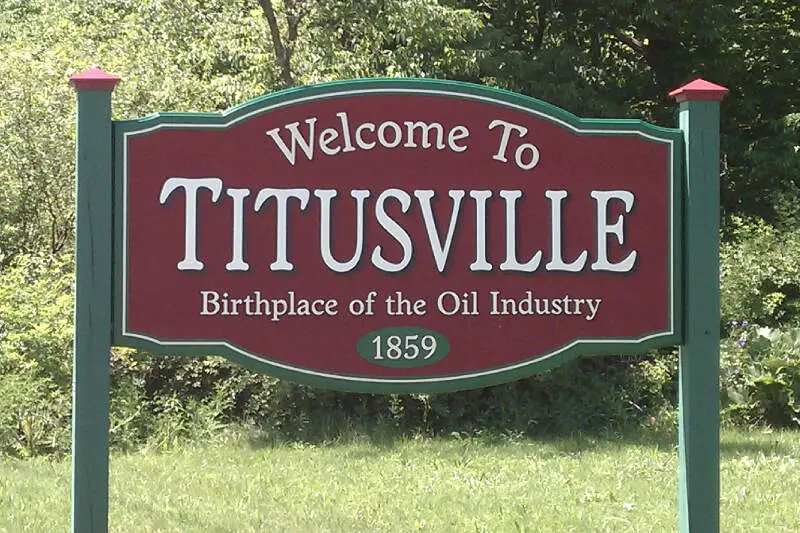
Titusville, PA Photos
1 Reviews & Comments About Titusville

It is amazing and SUPER cool! I love it here the weather is decent and the people are nice the money is high it is a weathy area too
Drakes Well stands out and all the cool painted buildings with historic figures and the mansions it feels like Beverley Hills
Rankings & Articles For Titusville


Locations Around Titusville
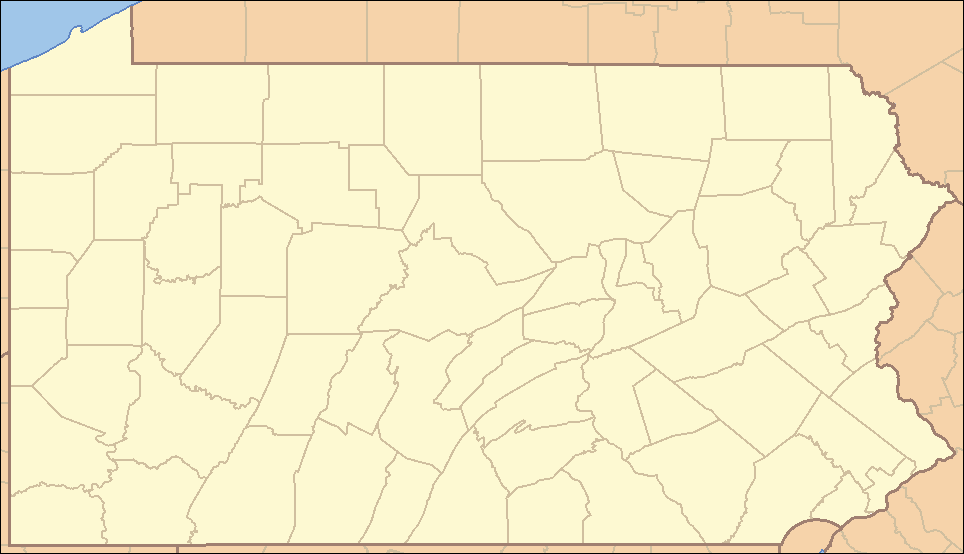
Map Of Titusville, PA
Best Places Around Titusville
Fredericksburg, TX
Population 11,419
Northwest Harborcreek, PA
Population 8,753
Meadville, PA
Population 12,577
Hermitage, PA
Population 16,041
Centerville, SC
Population 7,049
Warren, PA
Population 9,240
Franklin, PA
Population 265
Franklin, PA
Population 265
Titusville Demographics And Statistics
Population over time in Titusville
The current population in Titusville is 5,189. The population has decreased 9.0% from 2010.
| Year | Population | % Change |
|---|---|---|
| 2024 | 5,189 | -0.8% |
| 2023 | 5,230 | -0.6% |
| 2022 | 5,262 | -1.0% |
| 2021 | 5,314 | 2.2% |
| 2020 | 5,200 | -1.2% |
| 2019 | 5,264 | -1.4% |
| 2018 | 5,337 | -0.8% |
| 2017 | 5,381 | -0.7% |
| 2016 | 5,418 | -0.4% |
| 2015 | 5,438 | -0.7% |
| 2014 | 5,479 | -0.9% |
| 2013 | 5,528 | -1.3% |
| 2012 | 5,601 | -1.2% |
| 2011 | 5,670 | -0.5% |
| 2010 | 5,701 | - |
Race / Ethnicity in Titusville
See the full breakdown
Titusville is:
92.5% White with 4,800 White residents.
1.1% African American with 58 African American residents.
0.0% American Indian with 0 American Indian residents.
0.8% Asian with 40 Asian residents.
0.0% Hawaiian with 0 Hawaiian residents.
1.1% Other with 58 Other residents.
2.6% Two Or More with 137 Two Or More residents.
1.9% Hispanic with 96 Hispanic residents.
| Race | Titusville | PA | USA |
|---|---|---|---|
| White | 92.5% | 73.0% | 57.4% |
| African American | 1.1% | 10.3% | 11.9% |
| American Indian | 0.0% | 0.1% | 0.5% |
| Asian | 0.8% | 3.8% | 5.9% |
| Hawaiian | 0.0% | 0.0% | 0.2% |
| Other | 1.1% | 0.5% | 0.6% |
| Two Or More | 2.6% | 3.6% | 4.3% |
| Hispanic | 1.9% | 8.7% | 19.3% |
Gender in Titusville
See the full breakdown
Titusville is 54.2% female with 2,815 female residents.
Titusville is 45.8% male with 2,374 male residents.
| Gender | Titusville | PA | USA |
|---|---|---|---|
| Female | 54.2% | 50.7% | 50.5% |
| Male | 45.8% | 49.3% | 49.5% |
Highest level of educational attainment in Titusville for adults over 25
See the full breakdown
4.0% of adults in Titusville completed < 9th grade.
4.0% of adults in Titusville completed 9-12th grade.
50.0% of adults in Titusville completed high school / ged.
16.0% of adults in Titusville completed some college.
7.0% of adults in Titusville completed associate's degree.
13.0% of adults in Titusville completed bachelor's degree.
6.0% of adults in Titusville completed master's degree.
0.0% of adults in Titusville completed professional degree.
0.0% of adults in Titusville completed doctorate degree.
| Education | Titusville | PA | USA |
|---|---|---|---|
| < 9th Grade | 4.0% | 3.0% | 4.0% |
| 9-12th Grade | 4.0% | 5.0% | 6.0% |
| High School / GED | 50.0% | 33.0% | 26.0% |
| Some College | 16.0% | 15.0% | 19.0% |
| Associate's Degree | 7.0% | 9.0% | 9.0% |
| Bachelor's Degree | 13.0% | 21.0% | 22.0% |
| Master's Degree | 6.0% | 10.0% | 10.0% |
| Professional Degree | 0.0% | 2.0% | 2.0% |
| Doctorate Degree | 0.0% | 2.0% | 2.0% |
Household Income For Titusville, Pennsylvania
See the full breakdown
6.9% of households in Titusville earn Less than $10,000.
9.2% of households in Titusville earn $10,000 to $14,999.
18.2% of households in Titusville earn $15,000 to $24,999.
13.3% of households in Titusville earn $25,000 to $34,999.
12.6% of households in Titusville earn $35,000 to $49,999.
15.3% of households in Titusville earn $50,000 to $74,999.
13.9% of households in Titusville earn $75,000 to $99,999.
5.5% of households in Titusville earn $100,000 to $149,999.
3.0% of households in Titusville earn $150,000 to $199,999.
2.2% of households in Titusville earn $200,000 or more.
| Income | Titusville | PA | USA |
|---|---|---|---|
| Less than $10,000 | 6.9% | 4.9% | 5.0% |
| $10,000 to $14,999 | 9.2% | 3.5% | 3.4% |
| $15,000 to $24,999 | 18.2% | 6.7% | 6.3% |
| $25,000 to $34,999 | 13.3% | 6.9% | 6.6% |
| $35,000 to $49,999 | 12.6% | 10.5% | 10.1% |
| $50,000 to $74,999 | 15.3% | 15.9% | 15.5% |
| $75,000 to $99,999 | 13.9% | 12.8% | 12.6% |
| $100,000 to $149,999 | 5.5% | 17.7% | 17.5% |
| $150,000 to $199,999 | 3.0% | 9.3% | 9.6% |
| $200,000 or more | 2.2% | 11.8% | 13.4% |
Source: U.S. Census ACS 5-year estimates (2024)


