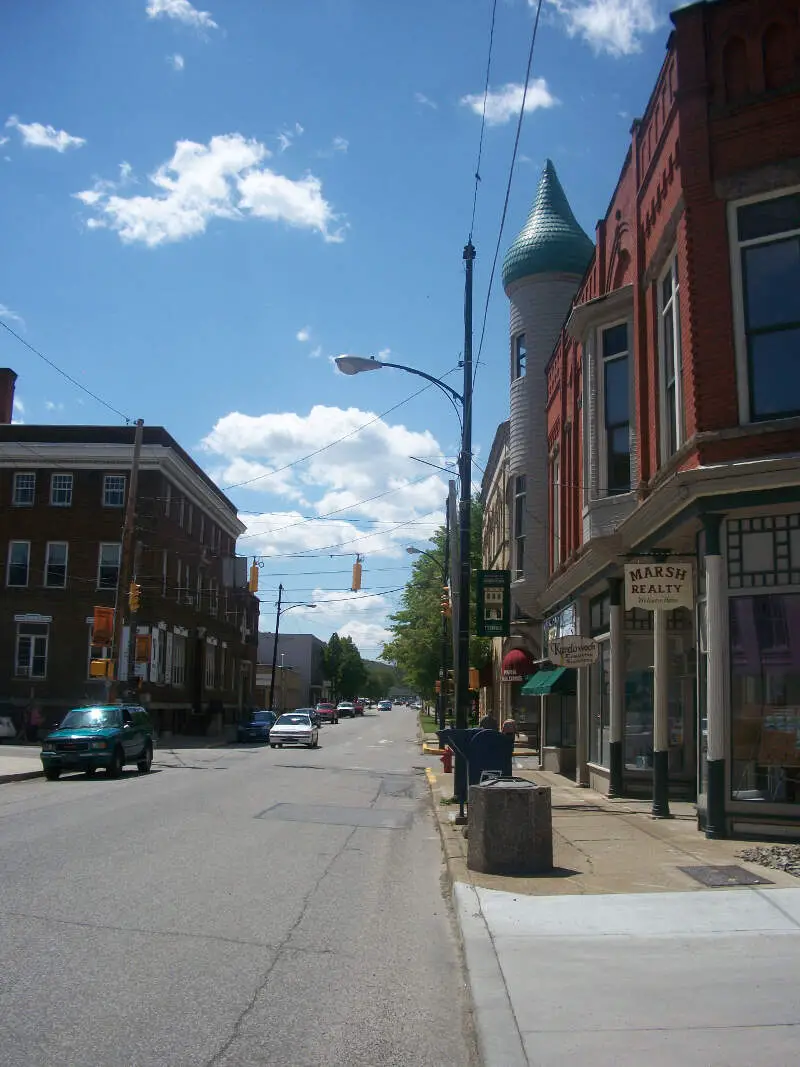
Titusville, PA
Demographics And Statistics
Living In Titusville, Pennsylvania Summary
Life in Titusville research summary. HomeSnacks has been using Saturday Night Science to research the quality of life in Titusville over the past nine years using Census, FBI, Zillow, and other primary data sources. Based on the most recently available data, we found the following about life in Titusville:
The population in Titusville is 5,230.
The median home value in Titusville is $117,857.
The median income in Titusville is $36,055.
The cost of living in Titusville is 84 which is 0.8x lower than the national average.
The median rent in Titusville is $596.
The unemployment rate in Titusville is 7.7%.
The poverty rate in Titusville is 22.4%.
The average high in Titusville is 57.2° and the average low is 36.1°.
Table Of Contents
Titusville SnackAbility
Overall SnackAbility
Titusville, PA Cost Of Living
Cost of living in Titusville summary. We use data on the cost of living to determine how expensive it is to live in Titusville. Real estate prices drive most of the variance in cost of living around Pennsylvania. Key points include:
The cost of living in Titusville is 84 with 100 being average.
The cost of living in Titusville is 0.8x lower than the national average.
The median home value in Titusville is $117,857.
The median income in Titusville is $36,055.
Titusville's Overall Cost Of Living
Lower Than The National Average
Cost Of Living In Titusville Comparison Table
| Living Expense | Titusville | Pennsylvania | National Average | |
|---|---|---|---|---|
| Overall | 84 | 100 | 100 | |
| Services | 96 | 101 | 100 | |
| Groceries | 98 | 101 | 100 | |
| Health | 90 | 95 | 100 | |
| Housing | 44 | 93 | 100 | |
| Transportation | 115 | 108 | 100 | |
| Utilities | 108 | 108 | 100 | |
Titusville, PA Weather
The average high in Titusville is 57.2° and the average low is 36.1°.
There are 101.1 days of precipitation each year.
Expect an average of 45.4 inches of precipitation each year with 81.6 inches of snow.
| Stat | Titusville |
|---|---|
| Average Annual High | 57.2 |
| Average Annual Low | 36.1 |
| Annual Precipitation Days | 101.1 |
| Average Annual Precipitation | 45.4 |
| Average Annual Snowfall | 81.6 |
Average High
Days of Rain
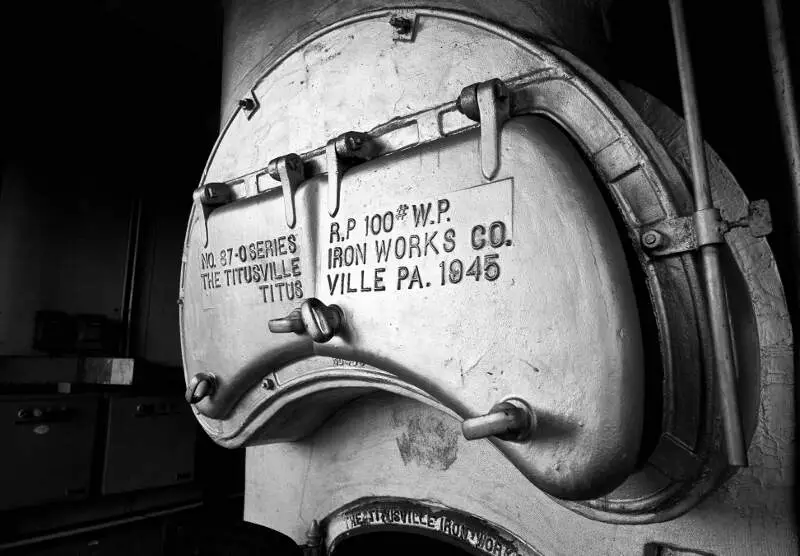
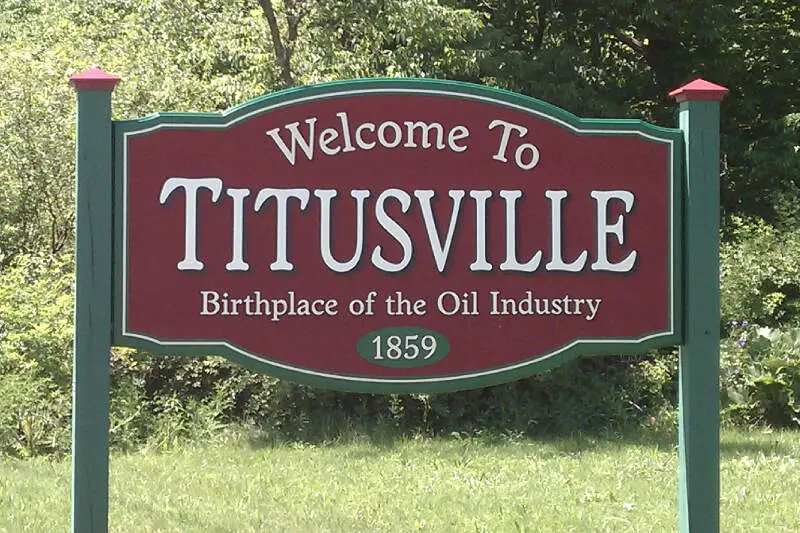
Titusville, PA Photos
1 Reviews & Comments About Titusville
/5

HomeSnacks User - 2019-03-13 19:09:32.496615
It is amazing and SUPER cool! I love it here the weather is decent and the people are nice the money is high it is a weathy area too
Drakes Well stands out and all the cool painted buildings with historic figures and the mansions it feels like Beverley Hills
Rankings for Titusville in Pennsylvania


Locations Around Titusville
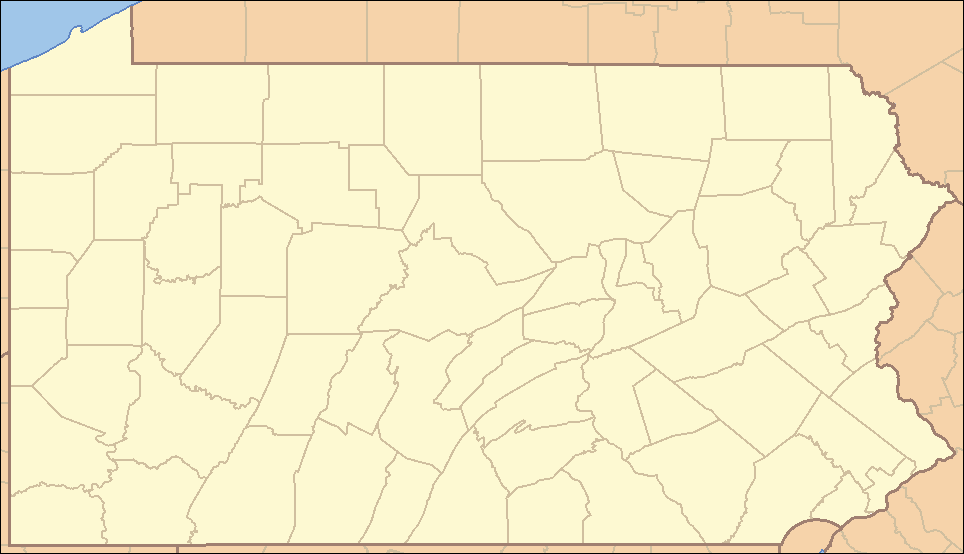
Map Of Titusville, PA
Best Places Around Titusville
Fredericksburg, TX
Population 11,254
Northwest Harborcreek, PA
Population 8,908
Meadville, PA
Population 12,723
Hermitage, PA
Population 16,132
Centerville, SC
Population 6,860
Warren, PA
Population 9,273
Franklin, PA
Population 289
Franklin, PA
Population 289
Titusville Demographics And Statistics
Population over time in Titusville
The current population in Titusville is 5,230. The population has decreased -8.3% from 2010.
| Year | Population | % Change |
|---|---|---|
| 2023 | 5,230 | -0.6% |
| 2022 | 5,262 | -1.0% |
| 2021 | 5,314 | 2.2% |
| 2020 | 5,200 | -1.2% |
| 2019 | 5,264 | -1.4% |
| 2018 | 5,337 | -0.8% |
| 2017 | 5,381 | -0.7% |
| 2016 | 5,418 | -0.4% |
| 2015 | 5,438 | -0.7% |
| 2014 | 5,479 | -0.9% |
| 2013 | 5,528 | -1.3% |
| 2012 | 5,601 | -1.2% |
| 2011 | 5,670 | -0.5% |
| 2010 | 5,701 | - |
Race / Ethnicity in Titusville
Titusville is:
93.8% White with 4,905 White residents.
1.7% African American with 88 African American residents.
0.0% American Indian with 0 American Indian residents.
1.1% Asian with 55 Asian residents.
0.0% Hawaiian with 0 Hawaiian residents.
1.0% Other with 50 Other residents.
1.6% Two Or More with 84 Two Or More residents.
0.9% Hispanic with 48 Hispanic residents.
| Race | Titusville | PA | USA |
|---|---|---|---|
| White | 93.8% | 73.8% | 58.2% |
| African American | 1.7% | 10.3% | 12.0% |
| American Indian | 0.0% | 0.1% | 0.5% |
| Asian | 1.1% | 3.7% | 5.7% |
| Hawaiian | 0.0% | 0.0% | 0.2% |
| Other | 1.0% | 0.4% | 0.5% |
| Two Or More | 1.6% | 3.3% | 3.9% |
| Hispanic | 0.9% | 8.4% | 19.0% |
Gender in Titusville
Titusville is 53.7% female with 2,808 female residents.
Titusville is 46.3% male with 2,422 male residents.
| Gender | Titusville | PA | USA |
|---|---|---|---|
| Female | 53.7% | 50.7% | 50.5% |
| Male | 46.3% | 49.3% | 49.5% |
Highest level of educational attainment in Titusville for adults over 25
1.0% of adults in Titusville completed < 9th grade.
4.0% of adults in Titusville completed 9-12th grade.
51.0% of adults in Titusville completed high school / ged.
17.0% of adults in Titusville completed some college.
8.0% of adults in Titusville completed associate's degree.
11.0% of adults in Titusville completed bachelor's degree.
7.0% of adults in Titusville completed master's degree.
1.0% of adults in Titusville completed professional degree.
0.0% of adults in Titusville completed doctorate degree.
| Education | Titusville | PA | USA |
|---|---|---|---|
| < 9th Grade | 1.0% | 3.0% | 5.0% |
| 9-12th Grade | 4.0% | 5.0% | 6.0% |
| High School / GED | 51.0% | 33.0% | 26.0% |
| Some College | 17.0% | 15.0% | 19.0% |
| Associate's Degree | 8.0% | 9.0% | 9.0% |
| Bachelor's Degree | 11.0% | 21.0% | 21.0% |
| Master's Degree | 7.0% | 10.0% | 10.0% |
| Professional Degree | 1.0% | 2.0% | 2.0% |
| Doctorate Degree | 0.0% | 2.0% | 2.0% |
Household Income For Titusville, Pennsylvania
4.2% of households in Titusville earn Less than $10,000.
13.3% of households in Titusville earn $10,000 to $14,999.
22.1% of households in Titusville earn $15,000 to $24,999.
9.8% of households in Titusville earn $25,000 to $34,999.
12.9% of households in Titusville earn $35,000 to $49,999.
15.4% of households in Titusville earn $50,000 to $74,999.
10.7% of households in Titusville earn $75,000 to $99,999.
7.5% of households in Titusville earn $100,000 to $149,999.
2.8% of households in Titusville earn $150,000 to $199,999.
1.3% of households in Titusville earn $200,000 or more.
| Income | Titusville | PA | USA |
|---|---|---|---|
| Less than $10,000 | 4.2% | 4.8% | 4.9% |
| $10,000 to $14,999 | 13.3% | 3.7% | 3.6% |
| $15,000 to $24,999 | 22.1% | 7.0% | 6.6% |
| $25,000 to $34,999 | 9.8% | 7.1% | 6.8% |
| $35,000 to $49,999 | 12.9% | 10.7% | 10.4% |
| $50,000 to $74,999 | 15.4% | 16.1% | 15.7% |
| $75,000 to $99,999 | 10.7% | 12.9% | 12.7% |
| $100,000 to $149,999 | 7.5% | 17.6% | 17.4% |
| $150,000 to $199,999 | 2.8% | 9.0% | 9.3% |
| $200,000 or more | 1.3% | 11.1% | 12.6% |


