
Every city has safe neighborhoods and dangerous neighborhhods. We believe you should know which neighborhoods in Bakersfield are the safest before you move.
Every year, more than 30 million Americans move. Sometimes, its for a job, other times its to escape the big city. But no matter where you move, you want a neighborhood thats family friendly, clean, and most importantly, safe.
Weve analyzed the FBI crime reports data on violent and property crimes for every single neighborhood in Bakersfield. Then, we calculated your chances of being the victim of a crime in each one.
What Bakersfield neighborhoods can you leave your doors unlocked at night? Heres the list.
Which neighborhood is the safest in Bakersfield in 2025? That would be Artisan. Thats according to the most recent FBI crime data, which takes into account everything from thefts and robberies to assaults and murders.
If you dont see a neighborhood youre looking for in our top , scroll down to the bottom, where we have all Bakersfield neighborhoods listed in order from safest to most dangerous.
For more California reading, check out:
- Safest Cities To Live In America
- Safest States To Live In America
- Worst neighborhoods in Bakersfield
- Best neighborhoods to live in Bakersfield.
Table Of Contents: Top 10 | Methodology | Summary | Table
The 10 Safest Neighborhoods To Live In Bakersfield For 2025
/10
Population: 4,098
Violent Crimes Per 100k: 129
Property Crime Per 100k: 1,170
/10
Population: 2,611
Violent Crimes Per 100k: 202
Property Crime Per 100k: 1,378
/10
Population: 2,266
Violent Crimes Per 100k: 2,558
Property Crime Per 100k: 12,037
/10
Population: 7,703
Violent Crimes Per 100k: 1,026
Property Crime Per 100k: 2,374
/10
Population: 4,785
Violent Crimes Per 100k: 330
Property Crime Per 100k: 1,817
/10
Population: 13,276
Violent Crimes Per 100k: 40
Property Crime Per 100k: 135
/10
Population: 3,585
Violent Crimes Per 100k: 294
Property Crime Per 100k: 2,007
/10
Population: 2,438
Violent Crimes Per 100k: 216
Property Crime Per 100k: 2,459
/10
Population: 4,384
Violent Crimes Per 100k: 120
Property Crime Per 100k: 3,077
/10
Population: 4,430
Violent Crimes Per 100k: 476
Property Crime Per 100k: 1,895
Methodology: How We Determined The Safest Bakersfield Hoods In 2025
You can ask people which neighborhoods are the safest, or you can look at the unbiased raw data. We choose data.
Instead of relying on speculation and opinion, we used Saturday Night Science to analyze the numbers from the FBI’s most recent crime report for every neighborhood in Bakersfield.
To be more specific, we analyzed the FBI’s Uniform Crime Report. We then ran an analysis to calculate each neighborhood’s property and violent crimes per capita. We used the following criteria:
- Total Crimes Per Capita
- Violent Crimes Per Capita
- Property Crimes Per Capita
We then ranked each neighborhood with scores from 1 to 39 in each category, where 1 was the safest.
Next, we averaged the rankings for each neighborhood to create a safe neighborhood index.
Finally, we crowned the neighborhood with the lowest safest neighborhood index the “Safest City Neighborhood In Bakersfield.” We’re lookin’ at you, Artisan.
We updated this article for 2025. This is our fourth time ranking the safest neighborhoods in Bakersfield.
Skip to the end to see the list of all the neighborhoods in the city, from safest to most expensive.
Summary: The Safest Places In Bakersfield
Looking at the data, you can tell that Artisan is as safe as they come, according to science and data.
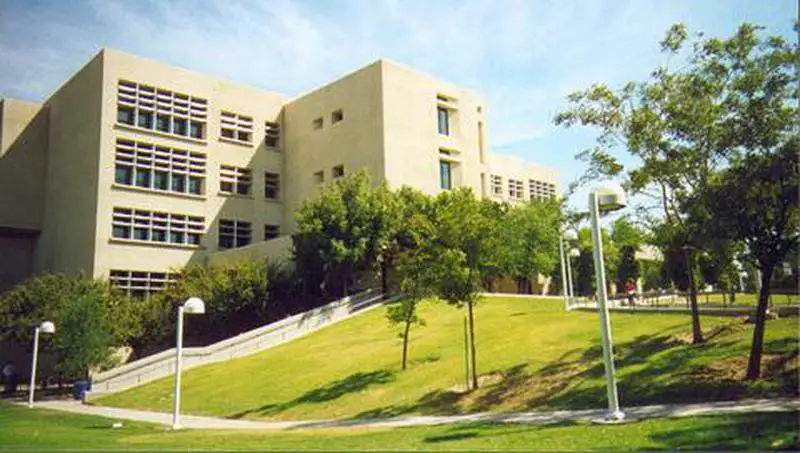
The safest neighborhoods in Bakersfield are Artisan, Southern Oaks, Csu Bakersfield, College Heights-Baker Street, Stonegate, Rio Bravo, Terra Vista, Stockdale Estates, The Oaks, and Tyner Homes.
But as most California residents would agree, almost every place here has its safe and not safe parts. So make sure you’re informed ahead of time.
The most dangerous neighborhoods in Bakersfield are Sagepointe, La Cresta-Altavista, Laurelglen, Quailwood, and Amberton.
We ranked the neighborhoods from safest to most dangerous in the chart below.
For more California reading, check out:
- Best Places To Live In California
- Cheapest Places To Live In California
- Most Dangerous Cities In California
- Richest Cities In California
- Safest Places In California
- Worst Places To Live In California
Detailed List Of The Safest Neighborhoods To Live In Bakersfield For 2025
| Rank | Neighborhood | Crime Per 100K |
|---|---|---|
| 1 | Artisan | 1,299 |
| 2 | Southern Oaks | 1,580 |
| 3 | Csu Bakersfield | 14,595 |
| 4 | College Heights-Baker Street | 3,400 |
| 5 | Stonegate | 2,147 |
| 6 | Rio Bravo | 175 |
| 7 | Terra Vista | 2,301 |
| 8 | Stockdale Estates | 2,675 |
| 9 | The Oaks | 3,197 |
| 10 | Tyner Homes | 2,371 |
| 11 | Seven Oaks | 2,972 |
| 12 | Ridgeview Estates | 2,739 |
| 13 | Castle Ranch | 2,944 |
| 14 | Eastridge Estates | 2,787 |
| 15 | Tevis Ranch | 3,057 |
| 16 | Southgate | 4,691 |
| 17 | Park Stockdale | 4,980 |
| 18 | Rexland Acres | 5,240 |
| 19 | Silver Creek | 3,089 |
| 20 | Casa Loma | 2,265 |
| 21 | The Seasons | 3,435 |
| 22 | Oleander Sunset | 5,434 |
| 23 | Lakeview | 12,286 |
| 24 | Benton Park | 5,716 |
| 25 | Downtown | 6,061 |
| 26 | Stockdale Greens | 3,797 |
| 27 | Riviera-Westchester | 3,860 |
| 28 | Hillcrest | 1,048 |
| 29 | Homaker Park | 6,622 |
| 30 | Haggin Oaks | 4,167 |
| 31 | Spice Tract | 7,209 |
| 32 | East Bakersfield | 6,690 |
| 33 | Bakersfield Country Club | 3,970 |
| 34 | Stone Meadows | 4,454 |
| 35 | Amberton | 9,170 |
| 36 | Quailwood | 4,791 |
| 37 | Laurelglen | 7,063 |
| 38 | La Cresta-Altavista | 8,382 |
| 39 | Sagepointe | 7,266 |