Compare Bakersfield to…
Bakersfield SnackAbility
Overall SnackAbility
Crime in Bakersfield summary. We use data from the FBI to determine the crime rates in Bakersfield. Key points include:
There were 12,585 total crimes in Bakersfield in the last reporting year.
The overall crime rate per 100,000 people in Bakersfield is 3,024.4 / 100k people.
The violent crime rate per 100,000 people in Bakersfield is 554.6 / 100k people.
The property crime rate per 100,000 people in Bakersfield is 2,469.7 / 100k people.
Overall, crime in Bakersfield is 42.71% above the national average.
Total Crimes
Above National Average
Crime In Bakersfield Comparison Table
| Statistic | Count Raw |
Bakersfield / 100k People |
California / 100k People |
National / 100k People |
|---|---|---|---|---|
| Total Crimes Per 100K | 12,585 | 3,024.4 | 2,564.5 | 2,119.2 |
| Violent Crime | 2,308 | 554.6 | 486.0 | 359.0 |
| Murder | 28 | 6.7 | 4.5 | 5.0 |
| Robbery | 523 | 125.7 | 119.1 | 61.0 |
| Aggravated Assault | 1,587 | 381.4 | 325.8 | 256.0 |
| Property Crime | 10,277 | 2,469.7 | 2,078.4 | 1,760.0 |
| Burglary | 2,237 | 537.6 | 305.8 | 229.0 |
| Larceny | 5,239 | 1,259.0 | 1,345.2 | 1,272.0 |
| Car Theft | 2,801 | 673.1 | 427.5 | 259.0 |
Source: FBI Uniform Crime Reporting (2024)
Cost of living in Bakersfield summary. We use data on the cost of living to determine how expensive it is to live in Bakersfield. Real estate prices drive most of the variance in cost of living around California. Key points include:
The cost of living in Bakersfield is 124 with 100 being average.
The cost of living in Bakersfield is 1.2x higher than the national average.
The median home value in Bakersfield is $396,047.
The median income in Bakersfield is $80,540.
Bakersfield's Overall Cost Of Living
Higher Than The National Average
Cost Of Living In Bakersfield Comparison Table
| Living Expense | Bakersfield | California | National Average |
|---|---|---|---|
| Overall | 124 | 142 | 100 |
| Services | 113 | 110 | 100 |
| Groceries | 117 | 118 | 100 |
| Health | 137 | 197 | 100 |
| Housing | 121 | 120 | 100 |
| Transportation | 118 | 121 | 100 |
| Utilities | 122 | 121 | 100 |
Source: Cost of living index, normalized to US average = 100
Bakersfield, CA Weather
The average high in Bakersfield is 75.7° and the average low is 48.6°.
There are 22.3 days of precipitation each year.
Expect an average of 8.4 inches of precipitation each year with 1.7 inches of snow.
| Stat | Bakersfield |
|---|---|
| Average Annual High | 75.7 |
| Average Annual Low | 48.6 |
| Annual Precipitation Days | 22.3 |
| Average Annual Precipitation | 8.4 |
| Average Annual Snowfall | 1.7 |
Average High
Days of Rain
Source: NOAA climate normals (30-year)
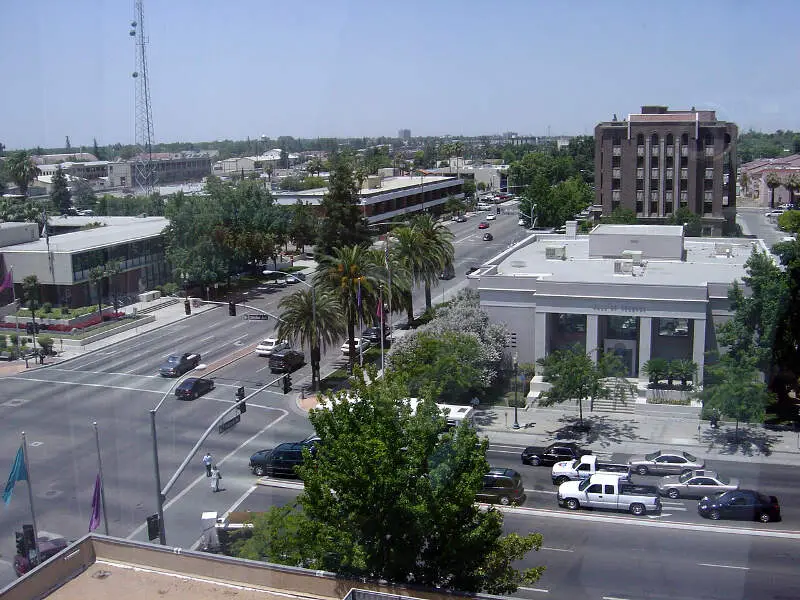
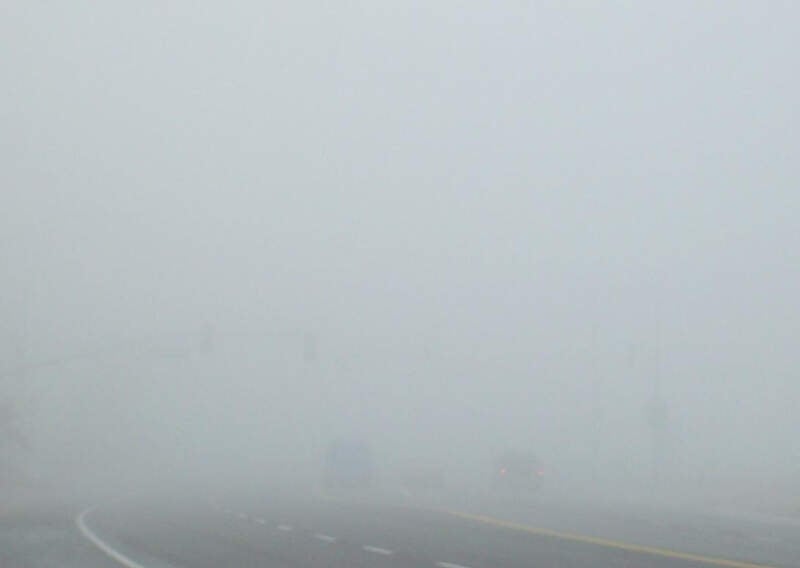
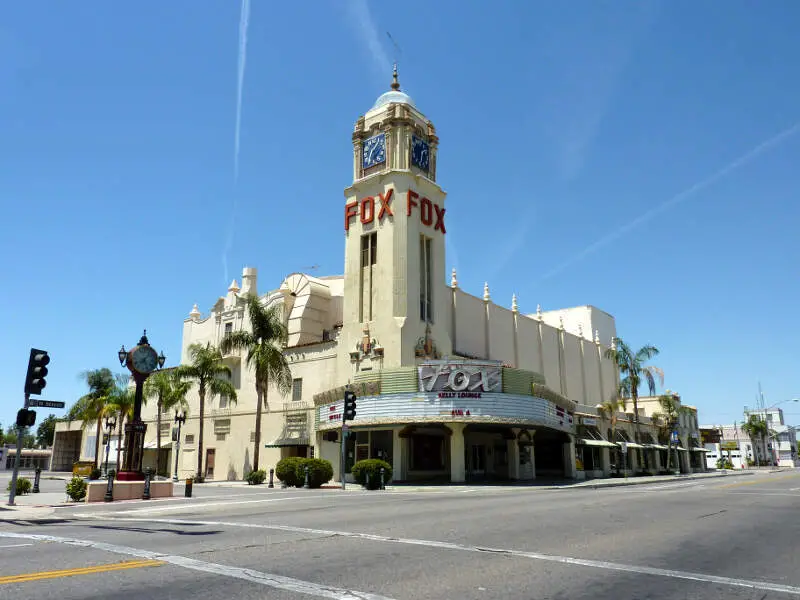
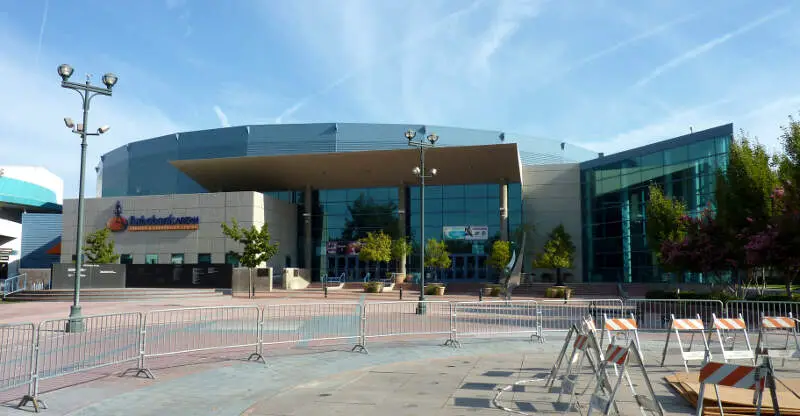
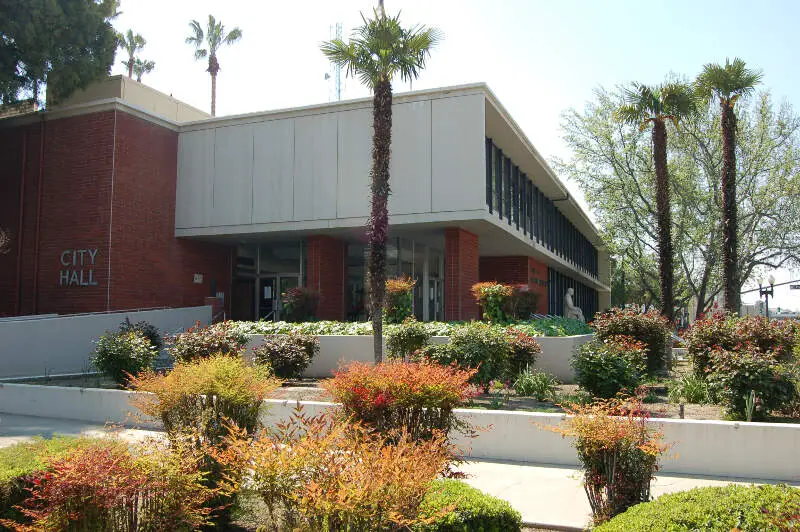
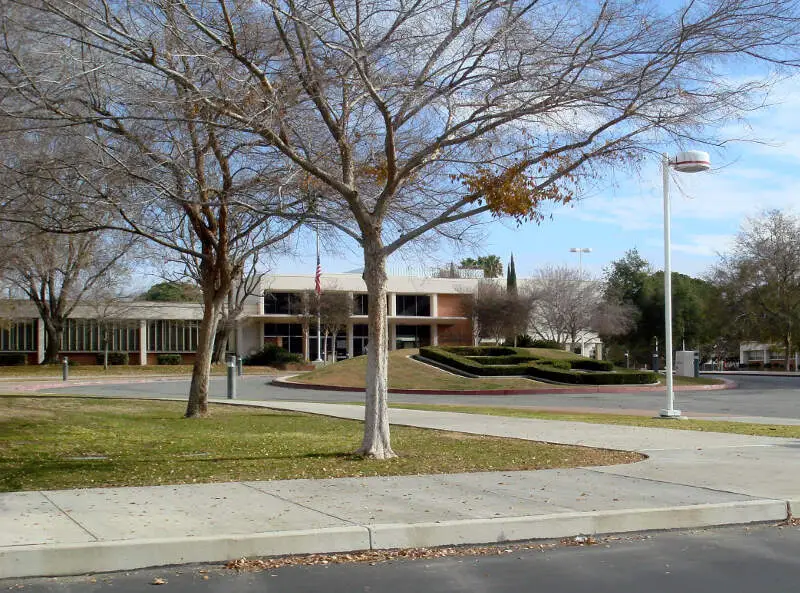
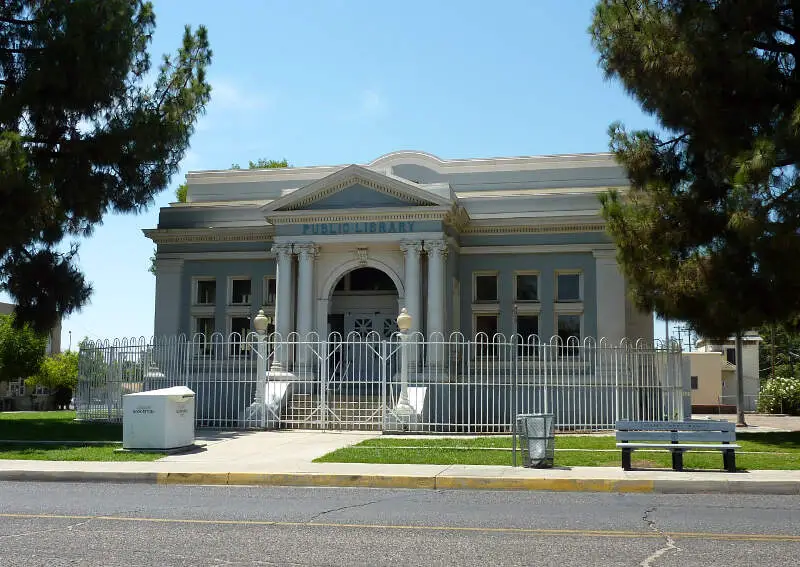
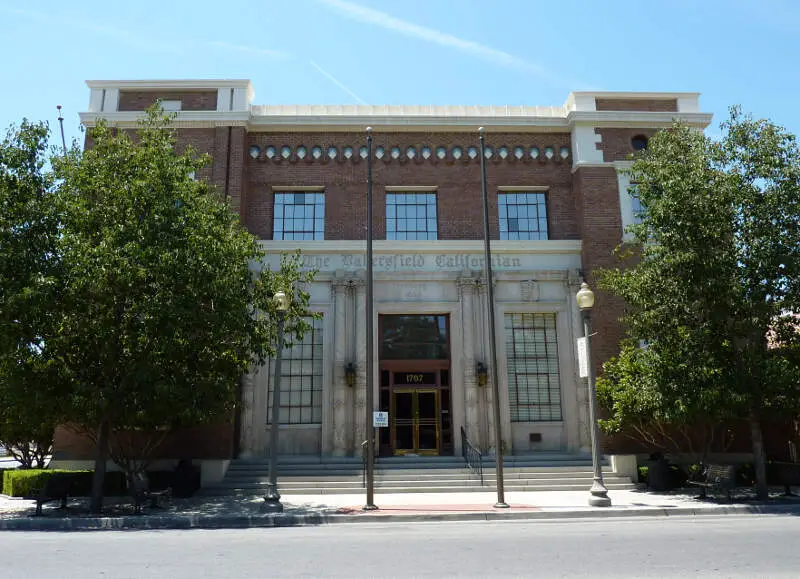
Bakersfield, CA Photos
1 Reviews & Comments About Bakersfield

Narcotics capital of California. Homelessness worse than Los Angeles. Crime moving in Southwest side of Bakersfield, sad because only good thing going for this town. Prostitution on Union Ave day & night. Roam free like nothing.
Not much to do except for Kern County Fair. Movie theaters, parks, few tiny malls. Not much of a night life.
Downtown taken over by crime.
Safest place hang out is on Buck Owens Blvd aka The Blvd & Crystal Palace.
Rankings & Articles For Bakersfield


Locations Around Bakersfield
Map Of Bakersfield, CA
Best Places Around Bakersfield
Greenfield, CA
Population 3,939
Rosedale, CA
Population 18,877
Shafter, CA
Population 21,193
Oildale, CA
Population 34,687
Lamont, CA
Population 13,164
Arvin, CA
Population 19,539
Bakersfield Demographics And Statistics
Population over time in Bakersfield
The current population in Bakersfield is 411,986. The population has increased 24.1% from 2010.
| Year | Population | % Change |
|---|---|---|
| 2024 | 411,986 | 0.9% |
| 2023 | 408,366 | 1.0% |
| 2022 | 404,321 | 1.4% |
| 2021 | 398,756 | 5.0% |
| 2020 | 379,879 | 0.5% |
| 2019 | 377,917 | 0.6% |
| 2018 | 375,699 | 0.8% |
| 2017 | 372,680 | 1.4% |
| 2016 | 367,555 | 1.1% |
| 2015 | 363,612 | 1.4% |
| 2014 | 358,700 | 1.6% |
| 2013 | 352,918 | 1.7% |
| 2012 | 347,091 | 2.2% |
| 2011 | 339,761 | 2.4% |
| 2010 | 331,868 | - |
Race / Ethnicity in Bakersfield
See the full breakdown
Bakersfield is:
27.6% White with 113,582 White residents.
5.7% African American with 23,536 African American residents.
0.4% American Indian with 1,555 American Indian residents.
7.8% Asian with 32,043 Asian residents.
0.1% Hawaiian with 461 Hawaiian residents.
0.7% Other with 2,818 Other residents.
3.1% Two Or More with 12,737 Two Or More residents.
54.7% Hispanic with 225,254 Hispanic residents.
| Race | Bakersfield | CA | USA |
|---|---|---|---|
| White | 27.6% | 33.8% | 57.4% |
| African American | 5.7% | 5.2% | 11.9% |
| American Indian | 0.4% | 0.3% | 0.5% |
| Asian | 7.8% | 15.3% | 5.9% |
| Hawaiian | 0.1% | 0.3% | 0.2% |
| Other | 0.7% | 0.6% | 0.6% |
| Two Or More | 3.1% | 4.4% | 4.3% |
| Hispanic | 54.7% | 40.2% | 19.3% |
Gender in Bakersfield
See the full breakdown
Bakersfield is 50.8% female with 209,263 female residents.
Bakersfield is 49.2% male with 202,722 male residents.
| Gender | Bakersfield | CA | USA |
|---|---|---|---|
| Female | 50.8% | 50.1% | 50.5% |
| Male | 49.2% | 49.9% | 49.5% |
Highest level of educational attainment in Bakersfield for adults over 25
See the full breakdown
9.0% of adults in Bakersfield completed < 9th grade.
9.0% of adults in Bakersfield completed 9-12th grade.
26.0% of adults in Bakersfield completed high school / ged.
24.0% of adults in Bakersfield completed some college.
8.0% of adults in Bakersfield completed associate's degree.
15.0% of adults in Bakersfield completed bachelor's degree.
6.0% of adults in Bakersfield completed master's degree.
2.0% of adults in Bakersfield completed professional degree.
1.0% of adults in Bakersfield completed doctorate degree.
| Education | Bakersfield | CA | USA |
|---|---|---|---|
| < 9th Grade | 9.0% | 8.0% | 4.0% |
| 9-12th Grade | 9.0% | 7.0% | 6.0% |
| High School / GED | 26.0% | 20.0% | 26.0% |
| Some College | 24.0% | 19.0% | 19.0% |
| Associate's Degree | 8.0% | 8.0% | 9.0% |
| Bachelor's Degree | 15.0% | 23.0% | 22.0% |
| Master's Degree | 6.0% | 10.0% | 10.0% |
| Professional Degree | 2.0% | 3.0% | 2.0% |
| Doctorate Degree | 1.0% | 2.0% | 2.0% |
Household Income For Bakersfield, California
See the full breakdown
4.6% of households in Bakersfield earn Less than $10,000.
4.2% of households in Bakersfield earn $10,000 to $14,999.
5.6% of households in Bakersfield earn $15,000 to $24,999.
6.8% of households in Bakersfield earn $25,000 to $34,999.
10.0% of households in Bakersfield earn $35,000 to $49,999.
15.7% of households in Bakersfield earn $50,000 to $74,999.
13.2% of households in Bakersfield earn $75,000 to $99,999.
19.2% of households in Bakersfield earn $100,000 to $149,999.
10.0% of households in Bakersfield earn $150,000 to $199,999.
10.6% of households in Bakersfield earn $200,000 or more.
| Income | Bakersfield | CA | USA |
|---|---|---|---|
| Less than $10,000 | 4.6% | 4.5% | 5.0% |
| $10,000 to $14,999 | 4.2% | 2.9% | 3.4% |
| $15,000 to $24,999 | 5.6% | 5.0% | 6.3% |
| $25,000 to $34,999 | 6.8% | 5.3% | 6.6% |
| $35,000 to $49,999 | 10.0% | 8.1% | 10.1% |
| $50,000 to $74,999 | 15.7% | 13.0% | 15.5% |
| $75,000 to $99,999 | 13.2% | 11.6% | 12.6% |
| $100,000 to $149,999 | 19.2% | 17.8% | 17.5% |
| $150,000 to $199,999 | 10.0% | 11.3% | 9.6% |
| $200,000 or more | 10.6% | 20.5% | 13.4% |
Source: U.S. Census ACS 5-year estimates (2024)


