
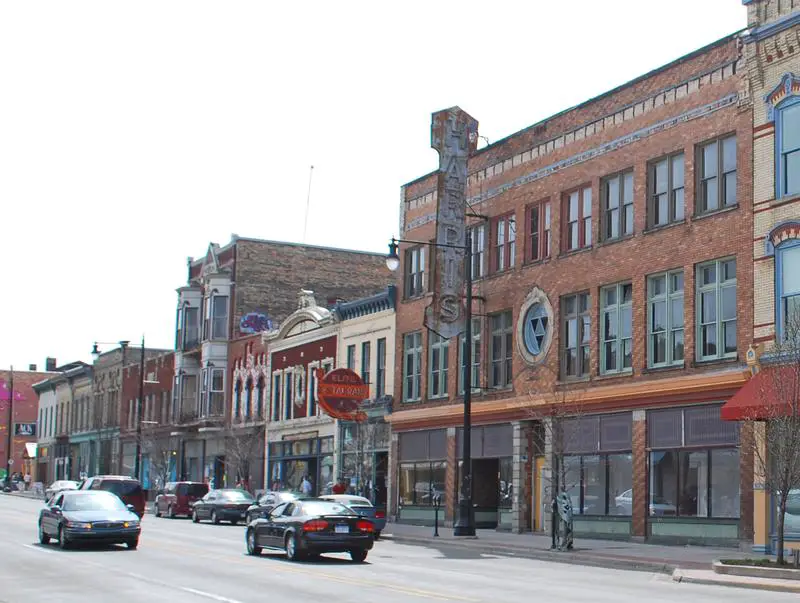
Every city has safe neighborhoods and dangerous neighborhhods. We believe you should know which neighborhoods in Grand Rapids are the safest before you move.
Every year, more than 30 million Americans move. Sometimes, its for a job, other times its to escape the big city. But no matter where you move, you want a neighborhood thats family friendly, clean, and most importantly, safe.
Weve analyzed the FBI crime reports data on violent and property crimes for every single neighborhood in Grand Rapids. Then, we calculated your chances of being the victim of a crime in each one.
What Grand Rapids neighborhoods can you leave your doors unlocked at night? Heres the list.
Which neighborhood is the safest in Grand Rapids in 2025? That would be Auburn Hill. Thats according to the most recent FBI crime data, which takes into account everything from thefts and robberies to assaults and murders.
If you dont see a neighborhood youre looking for in our top , scroll down to the bottom, where we have all Grand Rapids neighborhoods listed in order from safest to most dangerous.
For more Michigan reading, check out:
- Safest Cities To Live In America
- Safest States To Live In America
- Worst neighborhoods in Grand Rapids
- Best neighborhoods to live in Grand Rapids.
Table Of Contents: Top 10 | Methodology | Summary | Table
The 10 Safest Neighborhoods To Live In Grand Rapids For 2025
/10
Population: 213
Violent Crimes Per 100k: 1,105
Property Crime Per 100k: 1,597
/10
Population: 11,928
Violent Crimes Per 100k: 270
Property Crime Per 100k: 1,283
/10
Population: 800
Violent Crimes Per 100k: 353
Property Crime Per 100k: 1,217
/10
Population: 1,776
Violent Crimes Per 100k: 177
Property Crime Per 100k: 1,724
/10
Population: 6,637
Violent Crimes Per 100k: 260
Property Crime Per 100k: 2,050
/10
Population: 3,513
Violent Crimes Per 100k: 416
Property Crime Per 100k: 1,435
/10
Population: 3,424
Violent Crimes Per 100k: 1,100
Property Crime Per 100k: 2,682
/10
Population: 26,114
Violent Crimes Per 100k: 472
Property Crime Per 100k: 2,149
/10
Population: 899
Violent Crimes Per 100k: 1,309
Property Crime Per 100k: 2,648
/10
Population: 739
Violent Crimes Per 100k: 629
Property Crime Per 100k: 2,169
Methodology: How We Determined The Safest Grand Rapids Hoods In 2025
You can ask people which neighborhoods are the safest, or you can look at the unbiased raw data. We choose data.
Instead of relying on speculation and opinion, we used Saturday Night Science to analyze the numbers from the FBI’s most recent crime report for every neighborhood in Grand Rapids.
To be more specific, we analyzed the FBI’s Uniform Crime Report. We then ran an analysis to calculate each neighborhood’s property and violent crimes per capita. We used the following criteria:
- Total Crimes Per Capita
- Violent Crimes Per Capita
- Property Crimes Per Capita
We then ranked each neighborhood with scores from 1 to 32 in each category, where 1 was the safest.
Next, we averaged the rankings for each neighborhood to create a safe neighborhood index.
Finally, we crowned the neighborhood with the lowest safest neighborhood index the “Safest City Neighborhood In Grand Rapids.” We’re lookin’ at you, Auburn Hill.
We updated this article for 2025. This is our fourth time ranking the safest neighborhoods in Grand Rapids.
Skip to the end to see the list of all the neighborhoods in the city, from safest to most expensive.
Summary: The Safest Places In Grand Rapids
Looking at the data, you can tell that Auburn Hill is as safe as they come, according to science and data.
The safest neighborhoods in Grand Rapids are Auburn Hill, Westside Connection, Ottawa Hills, Michgan Oaks, Millbrook, Heartside, Madison Area, Creston, South Hill, and Cherry Run.
But as most Michigan residents would agree, almost every place here has its safe and not safe parts. So make sure you’re informed ahead of time.
The most dangerous neighborhoods in Grand Rapids are John Ball Park, South East End, Black Hills, Oakdale, and Swan.
We ranked the neighborhoods from safest to most dangerous in the chart below.
For more Michigan reading, check out:
- Best Places To Live In Michigan
- Cheapest Places To Live In Michigan
- Most Dangerous Places in Michigan
- Richest Cities In Michigan
- Safest Places In Michigan
- Worst Places To Live In Michigan
Detailed List Of The Safest Neighborhoods To Live In Grand Rapids For 2025
| Rank | Neighborhood | Crime Per 100K |
|---|---|---|
| 1 | Auburn Hill | 2,702 |
| 2 | Westside Connection | 1,553 |
| 3 | Ottawa Hills | 1,570 |
| 4 | Michgan Oaks | 1,901 |
| 5 | Millbrook | 2,310 |
| 6 | Heartside | 1,850 |
| 7 | Madison Area | 3,782 |
| 8 | Creston | 2,621 |
| 9 | South Hill | 3,957 |
| 10 | Cherry Run | 2,798 |
| 11 | Eastown | 3,074 |
| 12 | East Hills | 3,119 |
| 13 | Roosevelt Park | 4,313 |
| 14 | Garfield Park | 4,528 |
| 15 | Ridgemoor | 3,528 |
| 16 | Eastgate | 3,242 |
| 17 | South East Community | 13,782 |
| 18 | Heritage Hill | 3,359 |
| 19 | Highland Park | 3,424 |
| 20 | Midtown | 3,529 |
| 21 | Baxter | 5,419 |
| 22 | West Grand | 5,610 |
| 23 | Belknap Lookout | 5,668 |
| 24 | Fulton Heights | 9,286 |
| 25 | Norteast Citizens Action | 4,229 |
| 26 | Alger Heights | 4,048 |
| 27 | Fuller Avenue | 4,185 |
| 28 | Swan | 9,064 |
| 29 | Oakdale | 8,358 |
| 30 | Black Hills | 9,401 |
| 31 | South East End | 4,673 |
| 32 | John Ball Park | 5,095 |


