The 10 Safest Kansas City, MO Neighborhoods For 2025


The safest Kansas City neighborhoods are River Market and Blue Valley Industrial for 2025 based on Saturday Night Science.

Safest Neighborhoods In Kansas City
Source: Wikipedia User | CC-BY-SA-3.0

Every city has safe neighborhoods and dangerous neighborhhods. We believe you should know which neighborhoods in Kansas City are the safest before you move.

Every year, more than 30 million Americans move. Sometimes, its for a job, other times its to escape the big city. But no matter where you move, you want a neighborhood thats family friendly, clean, and most importantly, safe.

Weve analyzed the FBI crime reports data on violent and property crimes for every single neighborhood in Kansas City. Then, we calculated your chances of being the victim of a crime in each one.

What Kansas City neighborhoods can you leave your doors unlocked at night? Heres the list.

The Safest Neighborhoods In Kansas City For 2025

  1. River Market
  2. Blue Valley Industrial
  3. Martin City
  4. Blue Vue Hills
  5. Unity Ridge
  6. Central Business District-Downtown
  7. Western Hills
  8. Morningside
  9. Bannister Ares
  10. Ward Parkway Plaza

Which neighborhood is the safest in Kansas City in 2025? That would be River Market. Thats according to the most recent FBI crime data, which takes into account everything from thefts and robberies to assaults and murders.

If you dont see a neighborhood youre looking for in our top , scroll down to the bottom, where we have all Kansas City neighborhoods listed in order from safest to most dangerous.

For more Missouri reading, check out:


Table Of Contents: Top 10 | Methodology | Summary | Table


The 10 Safest Neighborhoods To Live In Kansas City For 2025

Overall SnackAbility

7
/10

Population: 2,247
Violent Crimes Per 100k: 1,443
Property Crime Per 100k: 10,053

Overall SnackAbility

2
/10

Population: 1,129
Violent Crimes Per 100k: 1,149
Property Crime Per 100k: 11,601

Overall SnackAbility

6
/10

Population: 825
Violent Crimes Per 100k: 1,015
Property Crime Per 100k: 3,407

Overall SnackAbility

8
/10

Population: 2,047
Violent Crimes Per 100k: 1,030
Property Crime Per 100k: 3,617

Overall SnackAbility

8.5
/10

Population: 1,150
Violent Crimes Per 100k: 141
Property Crime Per 100k: 2,476

Overall SnackAbility

8.5
/10

Population: 4,364
Violent Crimes Per 100k: 1,168
Property Crime Per 100k: 3,920

Overall SnackAbility

8
/10

Population: 1,935
Violent Crimes Per 100k: 1,261
Property Crime Per 100k: 4,232
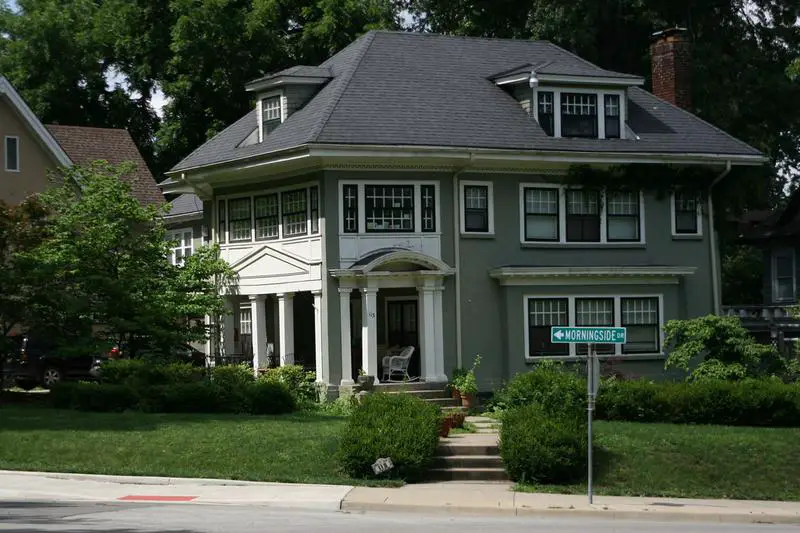
Morningside Kansas City, MO

Source: Flickr User pasa47 | CC BY 2.0
Overall SnackAbility

9.5
/10

Population: 1,534
Violent Crimes Per 100k: 1,004
Property Crime Per 100k: 9,157

Overall SnackAbility

7
/10

Population: 1,518
Violent Crimes Per 100k: 1,122
Property Crime Per 100k: 4,877

Overall SnackAbility

8.5
/10

Population: 472
Violent Crimes Per 100k: 1,312
Property Crime Per 100k: 4,402

Methodology: How We Determined The Safest Kansas City Hoods In 2025

You can ask people which neighborhoods are the safest, or you can look at the unbiased raw data. We choose data.

Instead of relying on speculation and opinion, we used Saturday Night Science to analyze the numbers from the FBI’s most recent crime report for every neighborhood in Kansas City.

To be more specific, we analyzed the FBI’s Uniform Crime Report. We then ran an analysis to calculate each neighborhood’s property and violent crimes per capita. We used the following criteria:

  • Total Crimes Per Capita
  • Violent Crimes Per Capita
  • Property Crimes Per Capita

We then ranked each neighborhood with scores from 1 to 124 in each category, where 1 was the safest.

Next, we averaged the rankings for each neighborhood to create a safe neighborhood index.

Finally, we crowned the neighborhood with the lowest safest neighborhood index the “Safest City Neighborhood In Kansas City.” We’re lookin’ at you, River Market.

We updated this article for 2025. This is our fourth time ranking the safest neighborhoods in Kansas City.

Skip to the end to see the list of all the neighborhoods in the city, from safest to most expensive.

Summary: The Safest Places In Kansas City

Looking at the data, you can tell that River Market is as safe as they come, according to science and data.

The safest neighborhoods in Kansas City are River Market, Blue Valley Industrial, Martin City, Blue Vue Hills, Unity Ridge, Central Business District-Downtown, Western Hills, Morningside, Bannister Ares, and Ward Parkway Plaza.

But as most Missouri residents would agree, almost every place here has its safe and not safe parts. So make sure you’re informed ahead of time.

The most dangerous neighborhoods in Kansas City are Union Hill, Ward Parkway, Little Blue Valley, Birdlespur, and West Blue Township.

We ranked the neighborhoods from safest to most dangerous in the chart below.

For more Missouri reading, check out:

Detailed List Of The Safest Neighborhoods To Live In Kansas City For 2025

Rank Neighborhood Crime Per 100K
1 River Market 11,496
2 Blue Valley Industrial 12,750
3 Martin City 4,423
4 Blue Vue Hills 4,647
5 Unity Ridge 2,617
6 Central Business District-Downtown 5,088
7 Western Hills 5,493
8 Morningside 10,161
9 Bannister Ares 5,999
10 Ward Parkway Plaza 5,714
11 Oldham Farms 14,020
12 Stayton Meadows 5,851
13 Richards Gebaur 6,577
14 Santa Fe Hills 10,180
15 Hanover Place 14,159
16 Riss Lake 14,725
17 North Hyde Park 6,045
18 Ingleside 10,007
19 Armour Hills 3,169
20 Willow Creek 6,765
21 Westside North 10,108
22 Wendell Phillips 14,278
23 Ruskin Heights 14,342
24 Eastwood Hills West 10,152
25 Tower Homes 6,956
26 Blue Hills Estates 2,390
27 Ivanhoe Northeast 10,161
28 Kirkside 6,845
29 Volker 7,185
30 Indipendence Plaza 10,180
31 East Community Team North 14,711
32 South Hyde Park 10,193
33 Key Coalition 10,236
34 Manheim Park 14,923
35 Country Valley-Hawthorn Square 7,094
36 Linwood Homeowner-Ivanhoe 10,183
37 Santa Fe 14,993
38 Lea Manor 11,943
39 Northest Industrial District 10,296
40 Loma Vista 11,071
41 Central Blue Valley-Park Tower Grade 10,591
42 Oak Park Southeast 7,629
43 Hickman Mills South 10,415
44 Sheffield 10,298
45 South Blue Valley 10,298
46 Bleheim Square-Research Hospital 10,298
47 Marlborough Heights-Marlborough Pride 10,298
48 North Blue Ridge 10,298
49 Ivanhoe Southeast 10,298
50 Robandee South 7,693
51 Swope Parkway-Elmwood 10,320
52 Faireway Hills 1,735
53 Eastwood Hill East 7,780
54 East Meyer 10,527
55 Vineyard 10,507
56 Ashland Ridge 11,429
57 Eastern 49-63 7,558
58 Oak Meyer Gardens 5,036
59 Bonne Hills 8,175
60 Westside South 11,227
61 Hillcrest 7,904
62 Linden Hills And Indian Heights 8,183
63 Brown Estates 7,796
64 Crown Center 2,574
65 Westwood 2,574
66 Country Club Plaza 2,574
67 Mission Lake 3,766
68 Fairlane 10,575
69 White Oak 2,757
70 Beacon Hills 8,234
71 Hidden Valley 10,886
72 Highview Estates 3,492
73 Ruskin Hills 8,301
74 North Town Fork Creek 8,239
75 Red Ridge South 4,947
76 Country Lane Estates 4,173
77 Central Hyde Park 8,697
78 Longfellow 3,288
79 Hickman Mills 8,354
80 Fairwood And Robandee 10,993
81 Sterling Acres 12,030
82 Pendleton Heights 11,143
83 Park Farms 8,544
84 Valentine 3,586
85 Lewis Heights 8,533
86 East Sqope Highlands 8,572
87 Plaza Westport 11,318
88 North India Mound 8,688
89 Southmoreland 9,181
90 Self Help Neighborhood Council 8,361
91 Stanford Estates 8,843
92 Norble And Gregory Ridge 12,030
93 Royal Oaks 5,364
94 Holmes Park 9,365
95 Swope Park Campus 8,969
96 Saint Catherine’s Gardens 5,382
97 South India Mound 12,401
98 Oak Park Southwest 12,549
99 Knoches Park 12,589
100 South Plaza 6,721
101 Palestine West And Oak Park Northeast 8,871
102 Blue Hills 9,676
103 Vineyard Northwest 12,979
104 Roanoke 9,690
105 West Plaza 6,737
106 Lykins 13,083
107 East Blue Valley 13,121
108 Washington Weatley 9,764
109 West Blue Valley 13,292
110 East Community Team South 13,251
111 Citadel 9,754
112 Oakwood 9,794
113 Oak Park Northwest 13,638
114 Sarritt Point 13,780
115 West Waldo 7,016
116 Legacy East 9,745
117 Western 49-63 7,305
118 South Town Fork Creek 14,368
119 Marlborough East 14,547
120 West Blue Township 8,029
121 Birdlespur 8,228
122 Little Blue Valley 8,244
123 Ward Parkway 8,417
124 Union Hill 8,697
About Chris Kolmar

Chris Kolmar has been in the real estate business for almost ten years now. He originally worked for Movoto Real Estate as the director of marketing before founding HomeSnacks.

He believes the key to finding the right place to live comes down to looking at the data, reading about things to do, and, most importantly, checking it out yourself before you move.

If you've been looking for a place to live in the past several years, you've probably stumbled upon his writing already.

You can find out more about him on LinkedIn or his website.