Compare Kansas City to…
Kansas City SnackAbility
Overall SnackAbility
Crime in Kansas City summary. We use data from the FBI to determine the crime rates in Kansas City. Key points include:
There were 31,834 total crimes in Kansas City in the last reporting year.
The overall crime rate per 100,000 people in Kansas City is 6,223.2 / 100k people.
The violent crime rate per 100,000 people in Kansas City is 1,547.1 / 100k people.
The property crime rate per 100,000 people in Kansas City is 4,676.1 / 100k people.
Overall, crime in Kansas City is 193.65% above the national average.
Total Crimes
Above National Average
Crime In Kansas City Comparison Table
| Statistic | Count Raw |
Kansas City / 100k People |
Missouri / 100k People |
National / 100k People |
|---|---|---|---|---|
| Total Crimes Per 100K | 31,834 | 6,223.2 | 2,403.3 | 2,119.2 |
| Violent Crime | 7,914 | 1,547.1 | 462.0 | 359.0 |
| Murder | 141 | 27.6 | 7.8 | 5.0 |
| Robbery | 1,299 | 253.9 | 51.5 | 61.0 |
| Aggravated Assault | 6,092 | 1,190.9 | 357.5 | 256.0 |
| Property Crime | 23,920 | 4,676.1 | 1,941.2 | 1,760.0 |
| Burglary | 2,508 | 490.3 | 236.3 | 229.0 |
| Larceny | 12,555 | 2,454.4 | 1,306.5 | 1,272.0 |
| Car Theft | 8,857 | 1,731.5 | 398.4 | 259.0 |
Source: FBI Uniform Crime Reporting (2024)
Cost of living in Kansas City summary. We use data on the cost of living to determine how expensive it is to live in Kansas City. Real estate prices drive most of the variance in cost of living around Missouri. Key points include:
The cost of living in Kansas City is 98 with 100 being average.
The cost of living in Kansas City is 1.0x lower than the national average.
The median home value in Kansas City is $250,207.
The median income in Kansas City is $69,166.
Kansas City's Overall Cost Of Living
Lower Than The National Average
Cost Of Living In Kansas City Comparison Table
| Living Expense | Kansas City | Missouri | National Average |
|---|---|---|---|
| Overall | 98 | 90 | 100 |
| Services | 99 | 97 | 100 |
| Groceries | 100 | 98 | 100 |
| Health | 95 | 76 | 100 |
| Housing | 95 | 95 | 100 |
| Transportation | 92 | 94 | 100 |
| Utilities | 95 | 96 | 100 |
Source: Cost of living index, normalized to US average = 100
Kansas City, MO Weather
The average high in Kansas City is 65.2° and the average low is 45.1°.
There are 64.3 days of precipitation each year.
Expect an average of 40.3 inches of precipitation each year with 14.5 inches of snow.
| Stat | Kansas City |
|---|---|
| Average Annual High | 65.2 |
| Average Annual Low | 45.1 |
| Annual Precipitation Days | 64.3 |
| Average Annual Precipitation | 40.3 |
| Average Annual Snowfall | 14.5 |
Average High
Days of Rain
Source: NOAA climate normals (30-year)
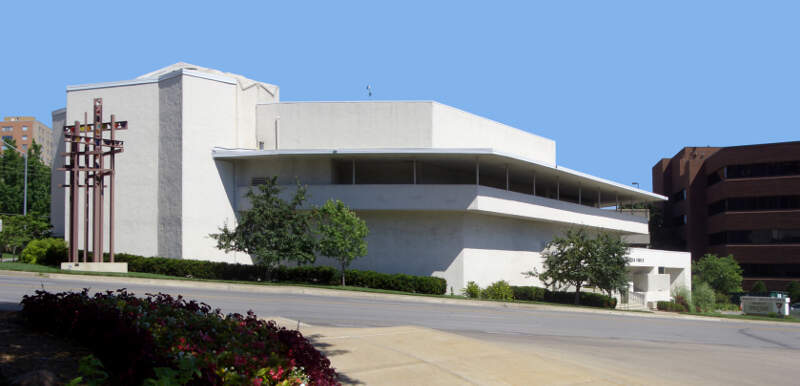
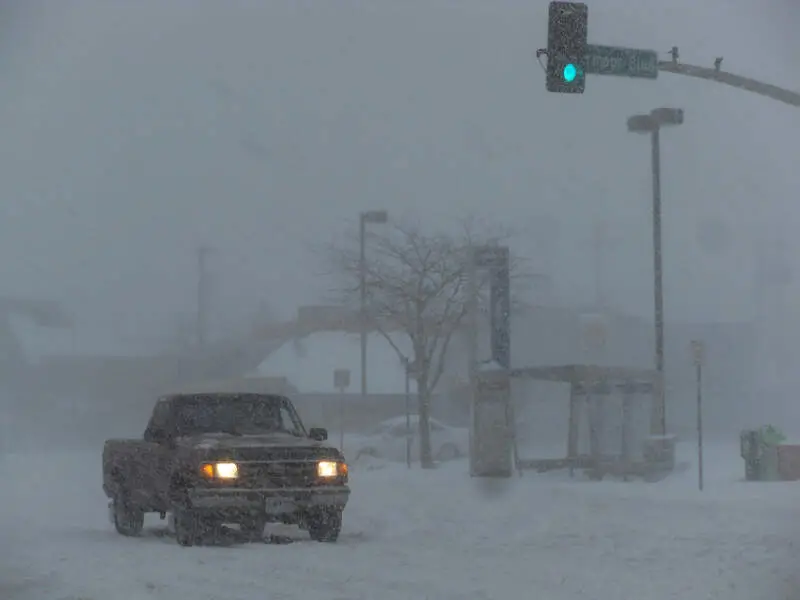
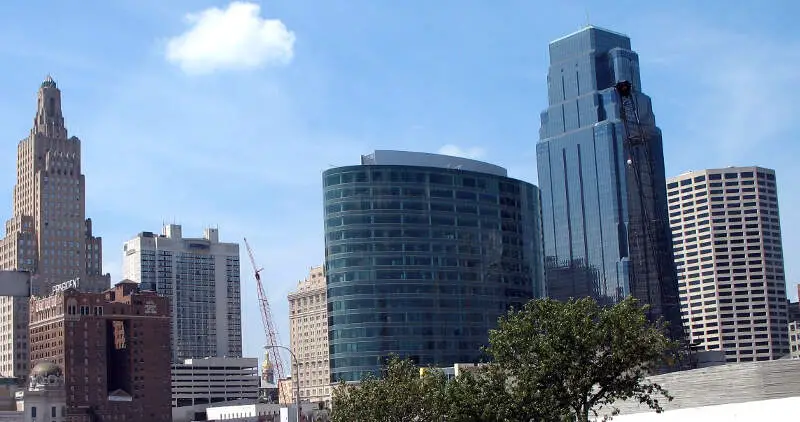
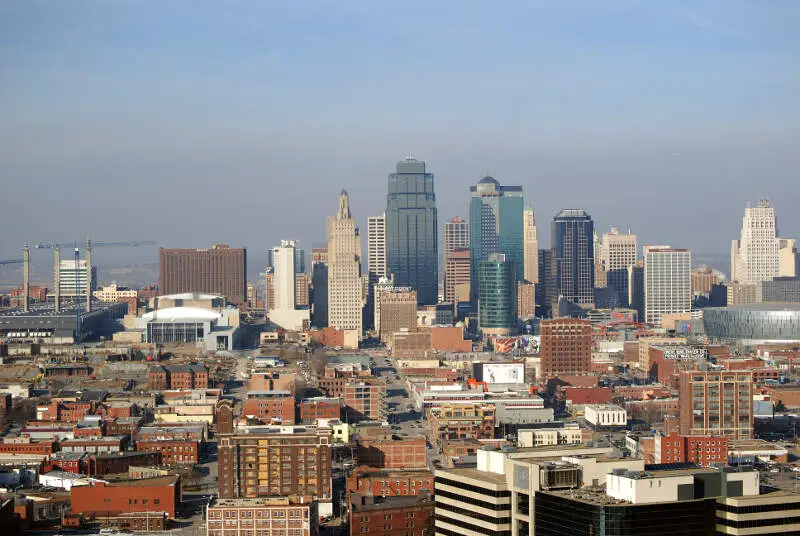
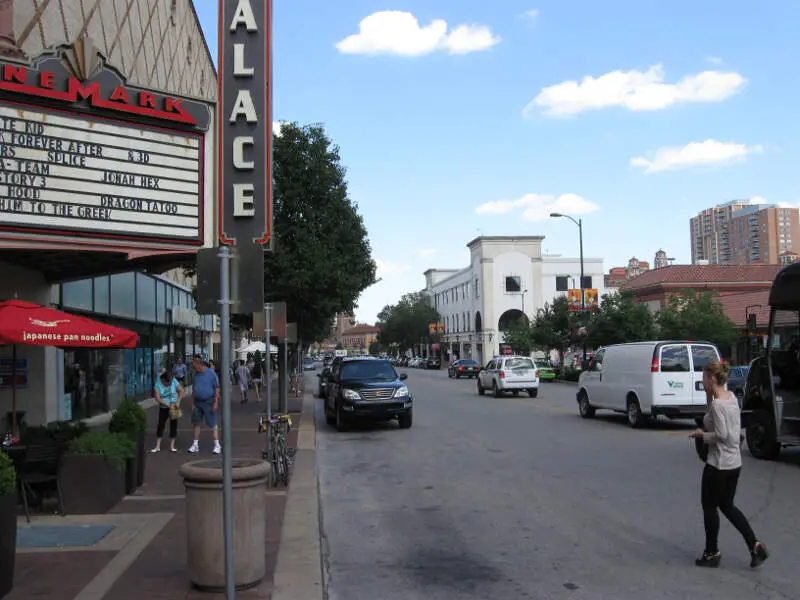
Kansas City, MO Photos


Rankings & Articles For Kansas City


Locations Around Kansas City
Map Of Kansas City, MO
Best Places Around Kansas City
Kansas City Demographics And Statistics
Population over time in Kansas City
The current population in Kansas City is 510,612. The population has increased 12.3% from 2010.
| Year | Population | % Change |
|---|---|---|
| 2024 | 510,612 | 0.5% |
| 2023 | 508,233 | 0.4% |
| 2022 | 505,958 | 0.7% |
| 2021 | 502,597 | 2.3% |
| 2020 | 491,158 | 1.0% |
| 2019 | 486,404 | 1.0% |
| 2018 | 481,417 | 0.9% |
| 2017 | 476,974 | 1.1% |
| 2016 | 471,767 | 0.8% |
| 2015 | 467,990 | 0.6% |
| 2014 | 465,005 | 0.6% |
| 2013 | 462,378 | 0.6% |
| 2012 | 459,772 | 0.5% |
| 2011 | 457,551 | 0.6% |
| 2010 | 454,876 | - |
Race / Ethnicity in Kansas City
See the full breakdown
Kansas City is:
54.0% White with 275,904 White residents.
25.2% African American with 128,681 African American residents.
0.1% American Indian with 511 American Indian residents.
2.8% Asian with 14,451 Asian residents.
0.2% Hawaiian with 951 Hawaiian residents.
0.5% Other with 2,598 Other residents.
4.7% Two Or More with 23,883 Two Or More residents.
12.5% Hispanic with 63,633 Hispanic residents.
| Race | Kansas City | MO | USA |
|---|---|---|---|
| White | 54.0% | 76.3% | 57.4% |
| African American | 25.2% | 10.9% | 11.9% |
| American Indian | 0.1% | 0.2% | 0.5% |
| Asian | 2.8% | 2.1% | 5.9% |
| Hawaiian | 0.2% | 0.1% | 0.2% |
| Other | 0.5% | 0.4% | 0.6% |
| Two Or More | 4.7% | 4.8% | 4.3% |
| Hispanic | 12.5% | 5.2% | 19.3% |
Gender in Kansas City
See the full breakdown
Kansas City is 51.7% female with 263,842 female residents.
Kansas City is 48.3% male with 246,769 male residents.
| Gender | Kansas City | MO | USA |
|---|---|---|---|
| Female | 51.7% | 50.7% | 50.5% |
| Male | 48.3% | 49.3% | 49.5% |
Highest level of educational attainment in Kansas City for adults over 25
See the full breakdown
3.0% of adults in Kansas City completed < 9th grade.
5.0% of adults in Kansas City completed 9-12th grade.
25.0% of adults in Kansas City completed high school / ged.
21.0% of adults in Kansas City completed some college.
7.0% of adults in Kansas City completed associate's degree.
24.0% of adults in Kansas City completed bachelor's degree.
11.0% of adults in Kansas City completed master's degree.
3.0% of adults in Kansas City completed professional degree.
1.0% of adults in Kansas City completed doctorate degree.
| Education | Kansas City | MO | USA |
|---|---|---|---|
| < 9th Grade | 3.0% | 4.0% | 4.0% |
| 9-12th Grade | 5.0% | 5.0% | 6.0% |
| High School / GED | 25.0% | 30.0% | 26.0% |
| Some College | 21.0% | 21.0% | 19.0% |
| Associate's Degree | 7.0% | 8.0% | 9.0% |
| Bachelor's Degree | 24.0% | 20.0% | 22.0% |
| Master's Degree | 11.0% | 9.0% | 10.0% |
| Professional Degree | 3.0% | 2.0% | 2.0% |
| Doctorate Degree | 1.0% | 1.0% | 2.0% |
Household Income For Kansas City, Missouri
See the full breakdown
6.4% of households in Kansas City earn Less than $10,000.
3.9% of households in Kansas City earn $10,000 to $14,999.
6.9% of households in Kansas City earn $15,000 to $24,999.
7.3% of households in Kansas City earn $25,000 to $34,999.
12.6% of households in Kansas City earn $35,000 to $49,999.
16.6% of households in Kansas City earn $50,000 to $74,999.
12.9% of households in Kansas City earn $75,000 to $99,999.
16.6% of households in Kansas City earn $100,000 to $149,999.
8.6% of households in Kansas City earn $150,000 to $199,999.
8.3% of households in Kansas City earn $200,000 or more.
| Income | Kansas City | MO | USA |
|---|---|---|---|
| Less than $10,000 | 6.4% | 4.9% | 5.0% |
| $10,000 to $14,999 | 3.9% | 3.8% | 3.4% |
| $15,000 to $24,999 | 6.9% | 7.1% | 6.3% |
| $25,000 to $34,999 | 7.3% | 7.8% | 6.6% |
| $35,000 to $49,999 | 12.6% | 11.9% | 10.1% |
| $50,000 to $74,999 | 16.6% | 17.4% | 15.5% |
| $75,000 to $99,999 | 12.9% | 13.2% | 12.6% |
| $100,000 to $149,999 | 16.6% | 17.1% | 17.5% |
| $150,000 to $199,999 | 8.6% | 8.2% | 9.6% |
| $200,000 or more | 8.3% | 8.7% | 13.4% |
Source: U.S. Census ACS 5-year estimates (2024)


