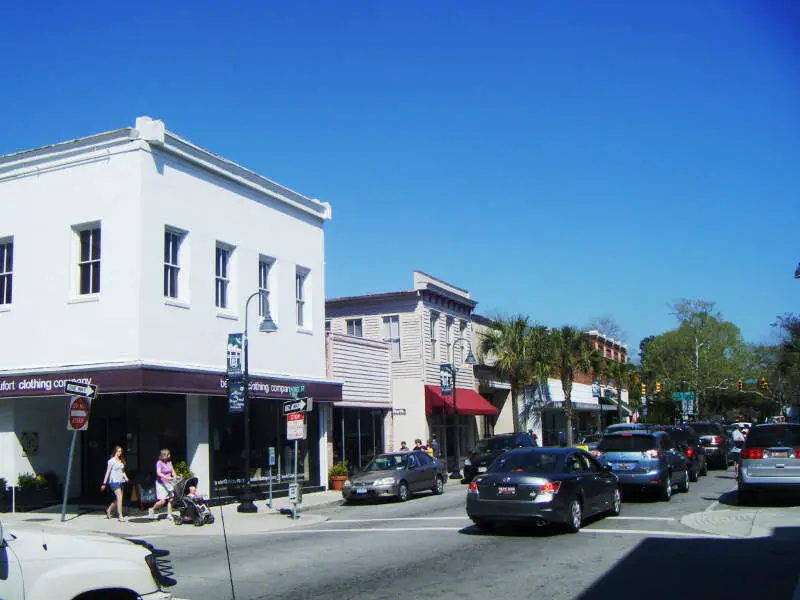
Beaufort, SC
Demographics And Statistics
Living In Beaufort, South Carolina Summary
Life in Beaufort research summary. HomeSnacks has been using Saturday Night Science to research the quality of life in Beaufort over the past nine years using Census, FBI, Zillow, and other primary data sources. Based on the most recently available data, we found the following about life in Beaufort:
The population in Beaufort is 13,660.
The median home value in Beaufort is $407,771.
The median income in Beaufort is $59,454.
The cost of living in Beaufort is 107 which is 1.1x higher than the national average.
The median rent in Beaufort is $1,061.
The unemployment rate in Beaufort is 3.9%.
The poverty rate in Beaufort is 18.0%.
The average high in Beaufort is 76.5° and the average low is 56.2°.
Beaufort SnackAbility
Overall SnackAbility
Beaufort, SC Crime Report
Crime in Beaufort summary. We use data from the FBI to determine the crime rates in Beaufort. Key points include:
There were 595 total crimes in Beaufort in the last reporting year.
The overall crime rate per 100,000 people in Beaufort is 4,269.2 / 100k people.
The violent crime rate per 100,000 people in Beaufort is 696.0 / 100k people.
The property crime rate per 100,000 people in Beaufort is 3,573.2 / 100k people.
Overall, crime in Beaufort is 101.45% above the national average.
Total Crimes
Above National Average
Crime In Beaufort Comparison Table
| Statistic | Count Raw |
Beaufort / 100k People |
South Carolina / 100k People |
National / 100k People |
|---|---|---|---|---|
| Total Crimes Per 100K | 595 | 4,269.2 | 2,402.5 | 2,119.2 |
| Violent Crime | 97 | 696.0 | 436.7 | 359.0 |
| Murder | 1 | 7.2 | 7.5 | 5.0 |
| Robbery | 15 | 107.6 | 35.1 | 61.0 |
| Aggravated Assault | 74 | 531.0 | 357.1 | 256.0 |
| Property Crime | 498 | 3,573.2 | 1,965.8 | 1,760.0 |
| Burglary | 45 | 322.9 | 282.4 | 229.0 |
| Larceny | 429 | 3,078.1 | 1,468.2 | 1,272.0 |
| Car Theft | 24 | 172.2 | 215.1 | 259.0 |
Beaufort, SC Cost Of Living
Cost of living in Beaufort summary. We use data on the cost of living to determine how expensive it is to live in Beaufort. Real estate prices drive most of the variance in cost of living around South Carolina. Key points include:
The cost of living in Beaufort is 107 with 100 being average.
The cost of living in Beaufort is 1.1x higher than the national average.
The median home value in Beaufort is $407,771.
The median income in Beaufort is $59,454.
Beaufort's Overall Cost Of Living
Higher Than The National Average
Cost Of Living In Beaufort Comparison Table
| Living Expense | Beaufort | South Carolina | National Average | |
|---|---|---|---|---|
| Overall | 107 | 93 | 100 | |
| Services | 105 | 102 | 100 | |
| Groceries | 97 | 97 | 100 | |
| Health | 101 | 92 | 100 | |
| Housing | 115 | 81 | 100 | |
| Transportation | 95 | 92 | 100 | |
| Utilities | 93 | 109 | 100 | |
Beaufort, SC Weather
The average high in Beaufort is 76.5° and the average low is 56.2°.
There are 73.1 days of precipitation each year.
Expect an average of 47.6 inches of precipitation each year with 0.2 inches of snow.
| Stat | Beaufort |
|---|---|
| Average Annual High | 76.5 |
| Average Annual Low | 56.2 |
| Annual Precipitation Days | 73.1 |
| Average Annual Precipitation | 47.6 |
| Average Annual Snowfall | 0.2 |
Average High
Days of Rain
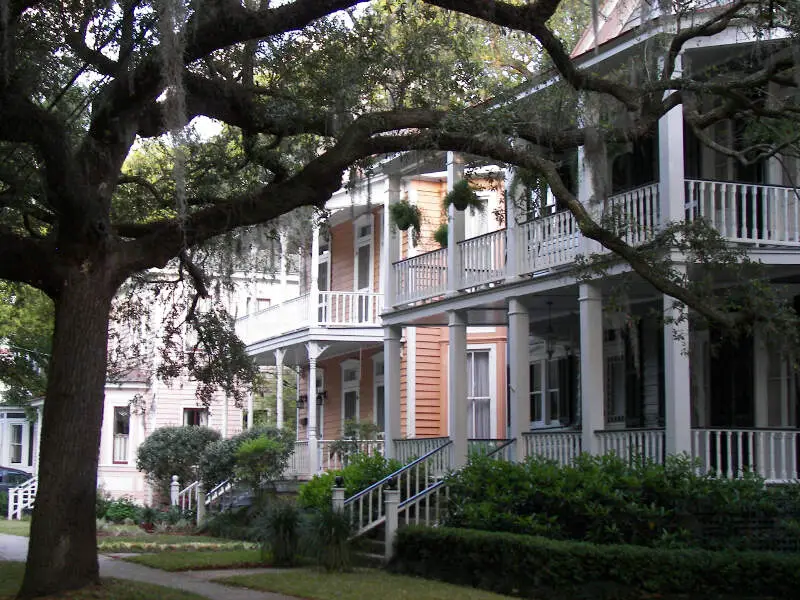
Beaufort, SC Photos


Rankings for Beaufort in South Carolina


Locations Around Beaufort
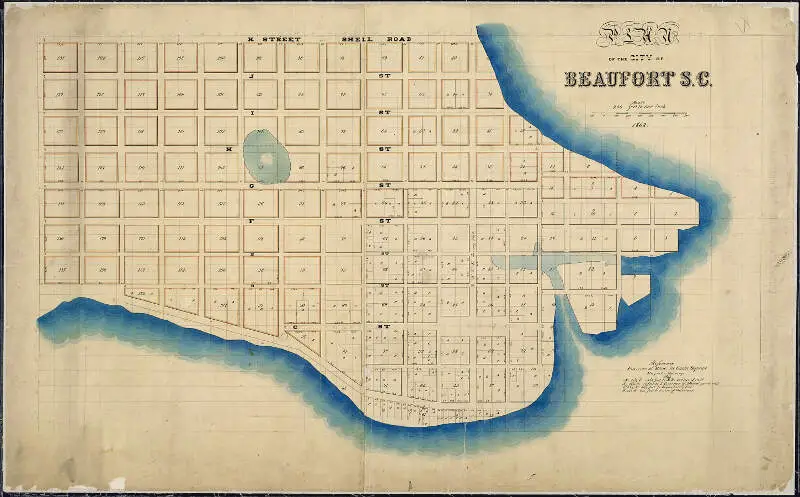
Map Of Beaufort, SC
Best Places Around Beaufort
Wilmington Island, GA
Population 14,457
Skidaway Island, GA
Population 8,907
Whitemarsh Island, GA
Population 6,918
Pooler, GA
Population 27,235
Georgetown, GA
Population 11,606
Richmond Hill, GA
Population 17,408
Port Wentworth, GA
Population 11,997
Hilton Head Island, SC
Population 37,805
Summerville, SC
Population 51,262
Beaufort Demographics And Statistics
Population over time in Beaufort
The current population in Beaufort is 13,660. The population has increased 9.3% from 2010.
| Year | Population | % Change |
|---|---|---|
| 2023 | 13,660 | 0.6% |
| 2022 | 13,582 | 5.3% |
| 2021 | 12,899 | -3.9% |
| 2020 | 13,417 | 0.1% |
| 2019 | 13,404 | 0.5% |
| 2018 | 13,336 | -0.6% |
| 2017 | 13,413 | 2.6% |
| 2016 | 13,074 | 1.8% |
| 2015 | 12,839 | 1.1% |
| 2014 | 12,702 | 1.0% |
| 2013 | 12,582 | 0.5% |
| 2012 | 12,522 | 0.3% |
| 2011 | 12,489 | -0.0% |
| 2010 | 12,492 | - |
Race / Ethnicity in Beaufort
Beaufort is:
61.5% White with 8,407 White residents.
27.5% African American with 3,762 African American residents.
0.3% American Indian with 42 American Indian residents.
0.8% Asian with 107 Asian residents.
0.0% Hawaiian with 0 Hawaiian residents.
0.1% Other with 13 Other residents.
3.4% Two Or More with 467 Two Or More residents.
6.3% Hispanic with 862 Hispanic residents.
| Race | Beaufort | SC | USA |
|---|---|---|---|
| White | 61.5% | 62.2% | 58.2% |
| African American | 27.5% | 25.1% | 12.0% |
| American Indian | 0.3% | 0.2% | 0.5% |
| Asian | 0.8% | 1.7% | 5.7% |
| Hawaiian | 0.0% | 0.1% | 0.2% |
| Other | 0.1% | 0.4% | 0.5% |
| Two Or More | 3.4% | 3.2% | 3.9% |
| Hispanic | 6.3% | 7.1% | 19.0% |
Gender in Beaufort
Beaufort is 49.6% female with 6,771 female residents.
Beaufort is 50.4% male with 6,889 male residents.
| Gender | Beaufort | SC | USA |
|---|---|---|---|
| Female | 49.6% | 51.3% | 50.5% |
| Male | 50.4% | 48.7% | 49.5% |
Highest level of educational attainment in Beaufort for adults over 25
1.0% of adults in Beaufort completed < 9th grade.
3.0% of adults in Beaufort completed 9-12th grade.
27.0% of adults in Beaufort completed high school / ged.
23.0% of adults in Beaufort completed some college.
8.0% of adults in Beaufort completed associate's degree.
21.0% of adults in Beaufort completed bachelor's degree.
12.0% of adults in Beaufort completed master's degree.
3.0% of adults in Beaufort completed professional degree.
2.0% of adults in Beaufort completed doctorate degree.
| Education | Beaufort | SC | USA |
|---|---|---|---|
| < 9th Grade | 1.0% | 4.0% | 5.0% |
| 9-12th Grade | 3.0% | 7.0% | 6.0% |
| High School / GED | 27.0% | 28.0% | 26.0% |
| Some College | 23.0% | 20.0% | 19.0% |
| Associate's Degree | 8.0% | 10.0% | 9.0% |
| Bachelor's Degree | 21.0% | 19.0% | 21.0% |
| Master's Degree | 12.0% | 9.0% | 10.0% |
| Professional Degree | 3.0% | 2.0% | 2.0% |
| Doctorate Degree | 2.0% | 1.0% | 2.0% |
Household Income For Beaufort, South Carolina
6.1% of households in Beaufort earn Less than $10,000.
3.2% of households in Beaufort earn $10,000 to $14,999.
8.7% of households in Beaufort earn $15,000 to $24,999.
7.2% of households in Beaufort earn $25,000 to $34,999.
18.3% of households in Beaufort earn $35,000 to $49,999.
12.2% of households in Beaufort earn $50,000 to $74,999.
15.4% of households in Beaufort earn $75,000 to $99,999.
12.6% of households in Beaufort earn $100,000 to $149,999.
5.1% of households in Beaufort earn $150,000 to $199,999.
11.1% of households in Beaufort earn $200,000 or more.
| Income | Beaufort | SC | USA |
|---|---|---|---|
| Less than $10,000 | 6.1% | 5.9% | 4.9% |
| $10,000 to $14,999 | 3.2% | 4.0% | 3.6% |
| $15,000 to $24,999 | 8.7% | 7.8% | 6.6% |
| $25,000 to $34,999 | 7.2% | 8.0% | 6.8% |
| $35,000 to $49,999 | 18.3% | 12.3% | 10.4% |
| $50,000 to $74,999 | 12.2% | 17.2% | 15.7% |
| $75,000 to $99,999 | 15.4% | 12.9% | 12.7% |
| $100,000 to $149,999 | 12.6% | 16.1% | 17.4% |
| $150,000 to $199,999 | 5.1% | 7.5% | 9.3% |
| $200,000 or more | 11.1% | 8.3% | 12.6% |


