Hilton Head Island SnackAbility
Overall SnackAbility
Cost of living in Hilton Head Island summary. We use data on the cost of living to determine how expensive it is to live in Hilton Head Island. Real estate prices drive most of the variance in cost of living around South Carolina. Key points include:
The cost of living in Hilton Head Island is 137 with 100 being average.
The cost of living in Hilton Head Island is 1.4x higher than the national average.
The median home value in Hilton Head Island is $787,678.
The median income in Hilton Head Island is $94,657.
Hilton Head Island's Overall Cost Of Living
Higher Than The National Average
Cost Of Living In Hilton Head Island Comparison Table
| Living Expense | Hilton Head Island | South Carolina | National Average |
|---|---|---|---|
| Overall | 137 | 92 | 100 |
| Services | 97 | 97 | 100 |
| Groceries | 97 | 96 | 100 |
| Health | 231 | 82 | 100 |
| Housing | 97 | 101 | 100 |
| Transportation | 103 | 101 | 100 |
| Utilities | 98 | 97 | 100 |
Source: Cost of living index, normalized to US average = 100
Hilton Head Island, SC Weather
The average high in Hilton Head Island is 75.5° and the average low is 57.6°.
There are 72.1 days of precipitation each year.
Expect an average of 51.3 inches of precipitation each year with 0.2 inches of snow.
| Stat | Hilton Head Island |
|---|---|
| Average Annual High | 75.5 |
| Average Annual Low | 57.6 |
| Annual Precipitation Days | 72.1 |
| Average Annual Precipitation | 51.3 |
| Average Annual Snowfall | 0.2 |
Average High
Days of Rain
Source: NOAA climate normals (30-year)
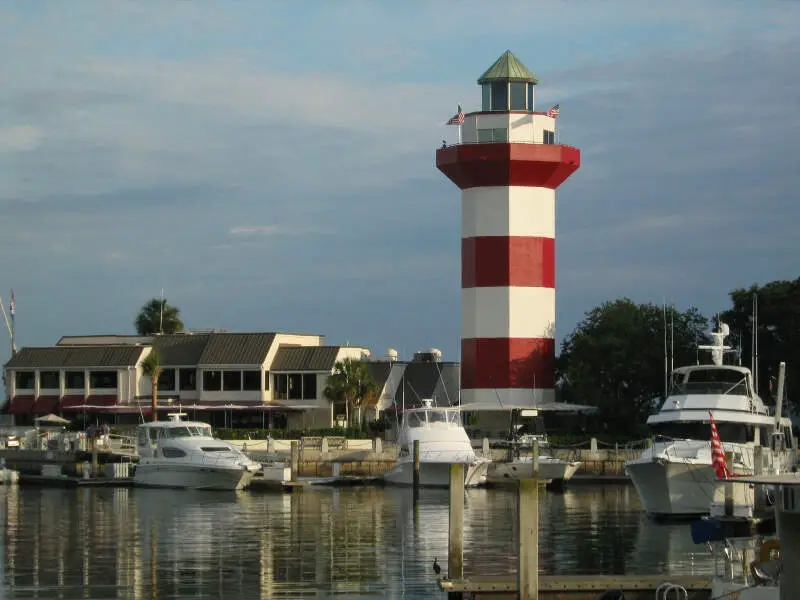
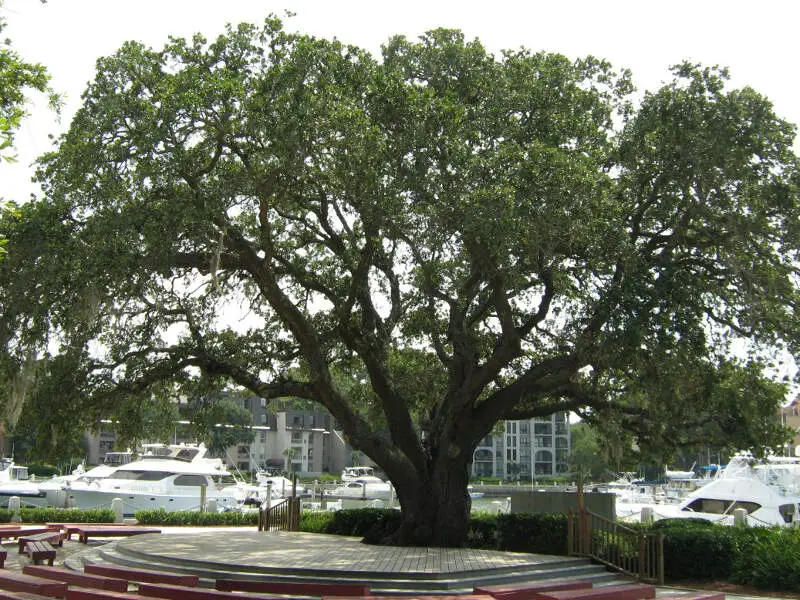
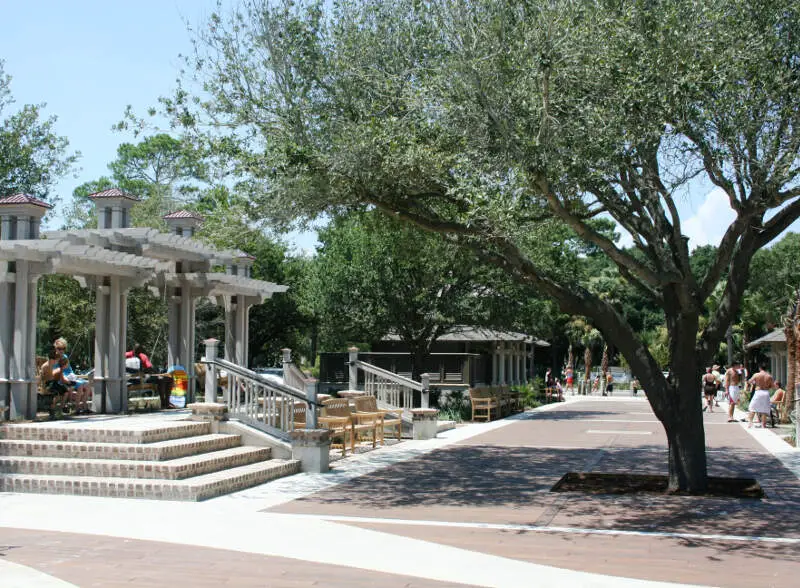
Hilton Head Island, SC Photos


1 Reviews & Comments About Hilton Head Island

The place is gorgeous and use to be wonderful. I moved away because the corruption and drugs are unbelievable. The hospital is horrible and tourist are lulled into believing they are safe. SC poverty is horrible and shootings in HHI and Bluffton are common. Theft is extremely high because of drugs.Stay out of Horry, Beaufort and Jasper counties if you visit South Carolina.
Charleston is fun but watch yourself at night. Do not go in the summer, the heat is horrible. The beach on Hilton Head is nice but stay off it at night; a 16 yr old girl was murdered,rapes are common and a 15 yr old shot an 18 yr old at Coligny beach, a woman was just found shot in the Target parking lot.Greenville is a pretty town and has many artists and the crime is lower. Myrtle Beach is fun but very dangerous from drug crime.
Rankings & Articles For Hilton Head Island


Locations Around Hilton Head Island
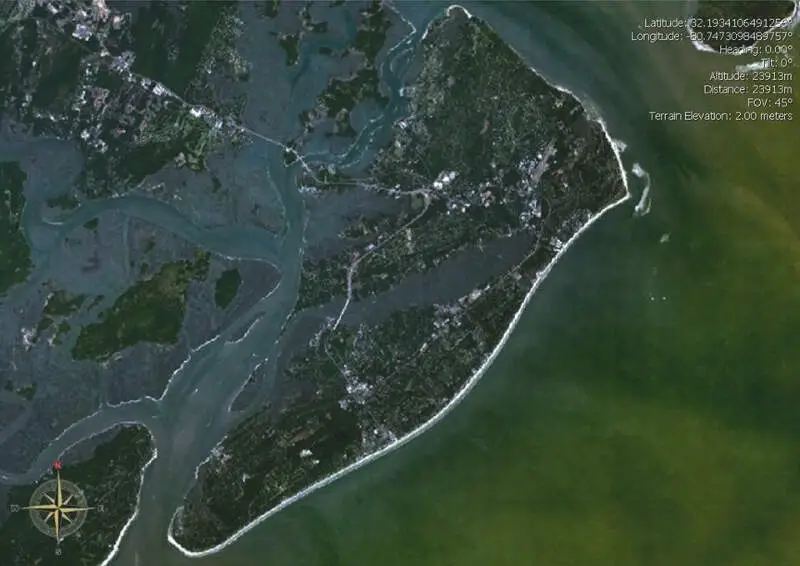
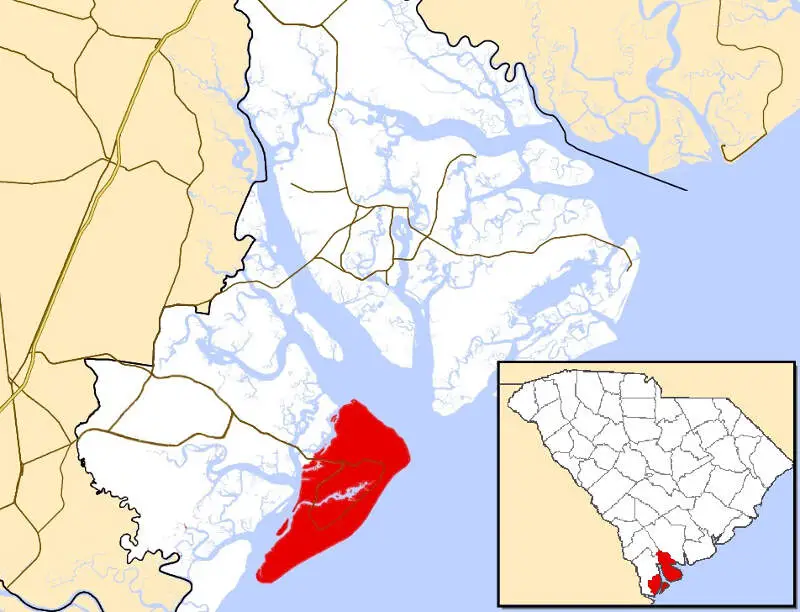
Map Of Hilton Head Island, SC
Best Places Around Hilton Head Island
Wilmington Island, GA
Population 13,905
Whitemarsh Island, GA
Population 6,886
Bluffton, SC
Population 33,157
Port Royal, SC
Population 15,579
Burton, SC
Population 6,912
Laurel Bay, SC
Population 5,882
Beaufort, SC
Population 13,747
Hilton Head Island Demographics And Statistics
Population over time in Hilton Head Island
The current population in Hilton Head Island is 37,911. The population has increased 3.3% from 2010.
| Year | Population | % Change |
|---|---|---|
| 2024 | 37,911 | 0.3% |
| 2023 | 37,805 | 0.3% |
| 2022 | 37,708 | -0.9% |
| 2021 | 38,068 | -4.8% |
| 2020 | 40,000 | -0.0% |
| 2019 | 40,007 | 0.5% |
| 2018 | 39,820 | 0.4% |
| 2017 | 39,666 | 0.0% |
| 2016 | 39,651 | 1.5% |
| 2015 | 39,071 | 1.5% |
| 2014 | 38,497 | 1.4% |
| 2013 | 37,965 | 1.5% |
| 2012 | 37,420 | 1.0% |
| 2011 | 37,058 | 0.9% |
| 2010 | 36,714 | - |
Race / Ethnicity in Hilton Head Island
See the full breakdown
Hilton Head Island is:
73.8% White with 27,995 White residents.
7.2% African American with 2,720 African American residents.
0.0% American Indian with 0 American Indian residents.
1.0% Asian with 382 Asian residents.
0.0% Hawaiian with 0 Hawaiian residents.
1.1% Other with 424 Other residents.
1.5% Two Or More with 584 Two Or More residents.
15.3% Hispanic with 5,806 Hispanic residents.
| Race | Hilton Head Island | SC | USA |
|---|---|---|---|
| White | 73.8% | 61.9% | 57.4% |
| African American | 7.2% | 24.6% | 11.9% |
| American Indian | 0.0% | 0.2% | 0.5% |
| Asian | 1.0% | 1.7% | 5.9% |
| Hawaiian | 0.0% | 0.0% | 0.2% |
| Other | 1.1% | 0.5% | 0.6% |
| Two Or More | 1.5% | 3.7% | 4.3% |
| Hispanic | 15.3% | 7.4% | 19.3% |
Gender in Hilton Head Island
See the full breakdown
Hilton Head Island is 50.5% female with 19,163 female residents.
Hilton Head Island is 49.5% male with 18,748 male residents.
| Gender | Hilton Head Island | SC | USA |
|---|---|---|---|
| Female | 50.5% | 51.3% | 50.5% |
| Male | 49.5% | 48.7% | 49.5% |
Highest level of educational attainment in Hilton Head Island for adults over 25
See the full breakdown
4.0% of adults in Hilton Head Island completed < 9th grade.
4.0% of adults in Hilton Head Island completed 9-12th grade.
17.0% of adults in Hilton Head Island completed high school / ged.
15.0% of adults in Hilton Head Island completed some college.
5.0% of adults in Hilton Head Island completed associate's degree.
31.0% of adults in Hilton Head Island completed bachelor's degree.
17.0% of adults in Hilton Head Island completed master's degree.
4.0% of adults in Hilton Head Island completed professional degree.
3.0% of adults in Hilton Head Island completed doctorate degree.
| Education | Hilton Head Island | SC | USA |
|---|---|---|---|
| < 9th Grade | 4.0% | 3.0% | 4.0% |
| 9-12th Grade | 4.0% | 7.0% | 6.0% |
| High School / GED | 17.0% | 28.0% | 26.0% |
| Some College | 15.0% | 20.0% | 19.0% |
| Associate's Degree | 5.0% | 10.0% | 9.0% |
| Bachelor's Degree | 31.0% | 20.0% | 22.0% |
| Master's Degree | 17.0% | 9.0% | 10.0% |
| Professional Degree | 4.0% | 2.0% | 2.0% |
| Doctorate Degree | 3.0% | 1.0% | 2.0% |
Household Income For Hilton Head Island, South Carolina
See the full breakdown
3.5% of households in Hilton Head Island earn Less than $10,000.
1.5% of households in Hilton Head Island earn $10,000 to $14,999.
4.9% of households in Hilton Head Island earn $15,000 to $24,999.
7.3% of households in Hilton Head Island earn $25,000 to $34,999.
8.3% of households in Hilton Head Island earn $35,000 to $49,999.
16.5% of households in Hilton Head Island earn $50,000 to $74,999.
10.2% of households in Hilton Head Island earn $75,000 to $99,999.
16.2% of households in Hilton Head Island earn $100,000 to $149,999.
10.4% of households in Hilton Head Island earn $150,000 to $199,999.
21.3% of households in Hilton Head Island earn $200,000 or more.
| Income | Hilton Head Island | SC | USA |
|---|---|---|---|
| Less than $10,000 | 3.5% | 5.9% | 5.0% |
| $10,000 to $14,999 | 1.5% | 3.8% | 3.4% |
| $15,000 to $24,999 | 4.9% | 7.3% | 6.3% |
| $25,000 to $34,999 | 7.3% | 7.7% | 6.6% |
| $35,000 to $49,999 | 8.3% | 11.9% | 10.1% |
| $50,000 to $74,999 | 16.5% | 17.0% | 15.5% |
| $75,000 to $99,999 | 10.2% | 13.1% | 12.6% |
| $100,000 to $149,999 | 16.2% | 16.4% | 17.5% |
| $150,000 to $199,999 | 10.4% | 8.0% | 9.6% |
| $200,000 or more | 21.3% | 8.9% | 13.4% |
Source: U.S. Census ACS 5-year estimates (2024)


