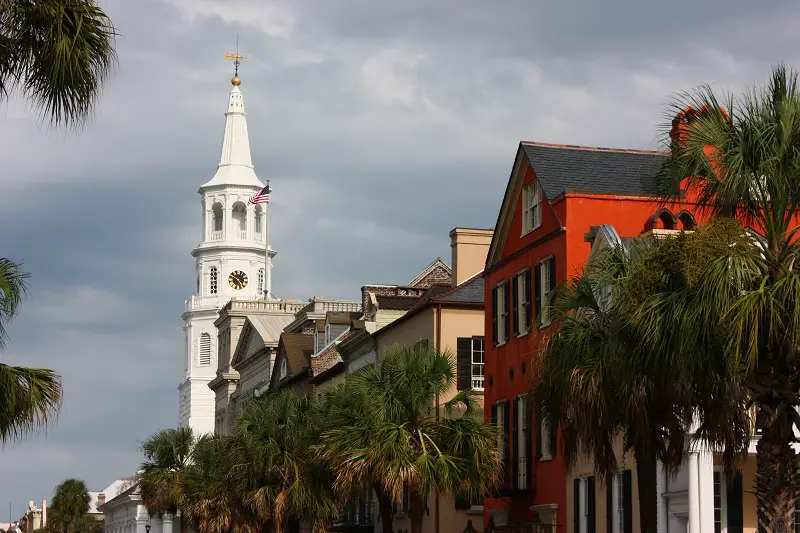

Life in Berkeley County research summary. HomeSnacks has been researching the quality of life in Berkeley County over the past eight years using Census data, FBI crime data, cost of living data, and other primary sources. Based on the most recently available data, we found the following about life in Berkeley County:
The population in Berkeley County is 231,419.
The median home value in Berkeley County is $358,791.
The median income in Berkeley County is $77,874.
The median rent in Berkeley County is $1,410.
The unemployment rate in Berkeley County is 3.8%.
The poverty rate in Berkeley County is 10.9%.
The average high in Berkeley County is 79.1° and there are 125.4 inches of rainfall annually.
The average high in Berkeley County is 79.1°.
There are 90.53 nice days each year.
Expect an average of 125.4 inches of rain each year with 0.2 inches of snow.
There is an average of 5:25 hours of sun each day in Berkeley County.
| Stat | Berkeley County |
|---|---|
| Mean High | 79.1 |
| Nice Days | 90.53 |
| Rainfall | 125.4 |
| Snowfall | 0.2 |
| Sunny_hours | 5:25 |


The current population in Berkeley County is 231,419. The population has increased 4.5% from 2019.
| Year | Population | % Change |
|---|---|---|
| 2022 | 224,806 | 1.2% |
| 2021 | 222,103 | 3.3% |
| 2020 | 215,044 | - |
Berkeley County is 50.0% female with 115,693 female residents.
Berkeley County is 50.0% male with 115,725 male residents.
| Gender | Berkeley County | SC | USA |
|---|---|---|---|
| Female | 50.0% | 51.2% | 50.4% |
| Male | 50.0% | 48.8% | 49.6% |
Berkeley County is:
62.1% White with 143,713 White residents.
23.1% African American with 53,497 African American residents.
0.3% American Indian with 594 American Indian residents.
2.3% Asian with 5,418 Asian residents.
0.1% Hawaiian with 180 Hawaiian residents.
0.4% Other with 983 Other residents.
4.4% Two Or More with 10,168 Two Or More residents.
7.3% Hispanic with 16,866 Hispanic residents.
| Race | Berkeley County | SC | USA |
|---|---|---|---|
| White | 62.1% | 63.0% | 58.9% |
| African American | 23.1% | 25.6% | 12.1% |
| American Indian | 0.3% | 0.2% | 0.6% |
| Asian | 2.3% | 1.7% | 5.7% |
| Hawaiian | 0.1% | 0.0% | 0.2% |
| Other | 0.4% | 0.4% | 0.4% |
| Two Or More | 4.4% | 2.9% | 3.5% |
| Hispanic | 7.3% | 6.2% | 18.7% |
4.3% of households in Berkeley County earn Less than $10,000.
2.8% of households in Berkeley County earn $10,000 to $14,999.
5.9% of households in Berkeley County earn $15,000 to $24,999.
7.5% of households in Berkeley County earn $25,000 to $34,999.
9.8% of households in Berkeley County earn $35,000 to $49,999.
17.5% of households in Berkeley County earn $50,000 to $74,999.
16.4% of households in Berkeley County earn $75,000 to $99,999.
20.8% of households in Berkeley County earn $100,000 to $149,999.
8.2% of households in Berkeley County earn $150,000 to $199,999.
6.8% of households in Berkeley County earn $200,000 or more.
| Income | Berkeley County | SC | USA |
|---|---|---|---|
| Less than $10,000 | 4.3% | 6.1% | 4.9% |
| $10,000 to $14,999 | 2.8% | 4.2% | 3.8% |
| $15,000 to $24,999 | 5.9% | 8.4% | 7.0% |
| $25,000 to $34,999 | 7.5% | 8.7% | 7.4% |
| $35,000 to $49,999 | 9.8% | 12.4% | 10.7% |
| $50,000 to $74,999 | 17.5% | 17.5% | 16.1% |
| $75,000 to $99,999 | 16.4% | 12.9% | 12.8% |
| $100,000 to $149,999 | 20.8% | 15.4% | 17.1% |
| $150,000 to $199,999 | 8.2% | 6.9% | 8.8% |
| $200,000 or more | 6.8% | 7.4% | 11.4% |
3.0% of adults in Berkeley County completed < 9th grade.
7.0% of adults in Berkeley County completed 9-12th grade.
29.0% of adults in Berkeley County completed high school / ged.
23.0% of adults in Berkeley County completed some college.
10.0% of adults in Berkeley County completed associate's degree.
18.0% of adults in Berkeley County completed bachelor's degree.
8.0% of adults in Berkeley County completed master's degree.
1.0% of adults in Berkeley County completed professional degree.
1.0% of adults in Berkeley County completed doctorate degree.
| Education | Berkeley County | SC | USA |
|---|---|---|---|
| < 9th Grade | 3% | 3% | 3% |
| 9-12th Grade | 7% | 7% | 6% |
| High School / GED | 28% | 28% | 26% |
| Some College | 23% | 20% | 20% |
| Associate's Degree | 10% | 10% | 9% |
| Bachelor's Degree | 18% | 19% | 21% |
| Master's Degree | 8% | 9% | 10% |
| Professional Degree | 1% | 2% | 2% |
| Doctorate Degree | 1% | 1% | 2% |
HomeSnacks is based in Durham, NC.
We aim to deliver bite-sized pieces of infotainment about where you live.
We use data, analytics, and a sense of humor to determine quality of life for places across the nation.