Conway SnackAbility
Overall SnackAbility
Crime in Conway summary. We use data from the FBI to determine the crime rates in Conway. Key points include:
There were 702 total crimes in Conway in the last reporting year.
The overall crime rate per 100,000 people in Conway is 2,419.4 / 100k people.
The violent crime rate per 100,000 people in Conway is 444.6 / 100k people.
The property crime rate per 100,000 people in Conway is 1,974.8 / 100k people.
Overall, crime in Conway is 14.17% above the national average.
Total Crimes
Above National Average
Crime In Conway Comparison Table
| Statistic | Count Raw |
Conway / 100k People |
South Carolina / 100k People |
National / 100k People |
|---|---|---|---|---|
| Total Crimes Per 100K | 702 | 2,419.4 | 2,402.5 | 2,119.2 |
| Violent Crime | 129 | 444.6 | 436.7 | 359.0 |
| Murder | 3 | 10.3 | 7.5 | 5.0 |
| Robbery | 8 | 27.6 | 35.1 | 61.0 |
| Aggravated Assault | 106 | 365.3 | 357.1 | 256.0 |
| Property Crime | 573 | 1,974.8 | 1,965.8 | 1,760.0 |
| Burglary | 30 | 103.4 | 282.4 | 229.0 |
| Larceny | 510 | 1,757.7 | 1,468.2 | 1,272.0 |
| Car Theft | 33 | 113.7 | 215.1 | 259.0 |
Source: FBI Uniform Crime Reporting (2024)
Cost of living in Conway summary. We use data on the cost of living to determine how expensive it is to live in Conway. Real estate prices drive most of the variance in cost of living around South Carolina. Key points include:
The cost of living in Conway is 94 with 100 being average.
The cost of living in Conway is 0.9x lower than the national average.
The median home value in Conway is $286,177.
The median income in Conway is $56,650.
Conway's Overall Cost Of Living
Lower Than The National Average
Cost Of Living In Conway Comparison Table
| Living Expense | Conway | South Carolina | National Average |
|---|---|---|---|
| Overall | 94 | 92 | 100 |
| Services | 99 | 97 | 100 |
| Groceries | 99 | 96 | 100 |
| Health | 90 | 82 | 100 |
| Housing | 96 | 101 | 100 |
| Transportation | 98 | 101 | 100 |
| Utilities | 99 | 97 | 100 |
Source: Cost of living index, normalized to US average = 100
Conway, SC Weather
The average high in Conway is 74.9° and the average low is 52.5°.
There are 73.0 days of precipitation each year.
Expect an average of 52.0 inches of precipitation each year with 0.8 inches of snow.
| Stat | Conway |
|---|---|
| Average Annual High | 74.9 |
| Average Annual Low | 52.5 |
| Annual Precipitation Days | 73.0 |
| Average Annual Precipitation | 52.0 |
| Average Annual Snowfall | 0.8 |
Average High
Days of Rain
Source: NOAA climate normals (30-year)
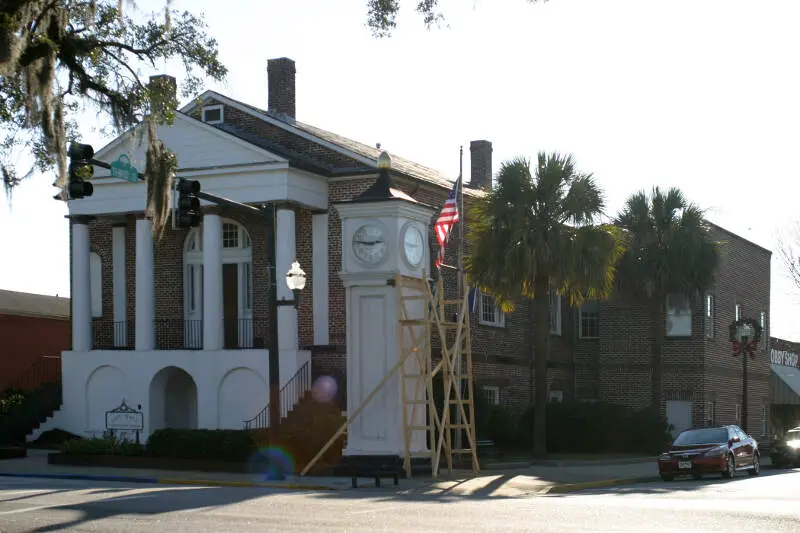
Conway, SC Photos


Rankings & Articles For Conway


Locations Around Conway
Map Of Conway, SC
Best Places Around Conway
Murrells Inlet, SC
Population 10,044
Red Hill, SC
Population 15,920
Little River, SC
Population 11,771
Socastee, SC
Population 23,796
Florence, SC
Population 40,408
North Myrtle Beach, SC
Population 19,855
Georgetown, SC
Population 8,565
Myrtle Beach, SC
Population 38,371
Marion, SC
Population 6,206
Conway Demographics And Statistics
Population over time in Conway
The current population in Conway is 27,263. The population has increased 66.0% from 2010.
| Year | Population | % Change |
|---|---|---|
| 2024 | 27,263 | 4.5% |
| 2023 | 26,082 | 3.8% |
| 2022 | 25,121 | 14.2% |
| 2021 | 22,001 | -11.1% |
| 2020 | 24,747 | 3.8% |
| 2019 | 23,838 | 5.2% |
| 2018 | 22,661 | 5.2% |
| 2017 | 21,534 | 4.4% |
| 2016 | 20,631 | 6.6% |
| 2015 | 19,356 | 3.8% |
| 2014 | 18,645 | 3.5% |
| 2013 | 18,008 | 3.1% |
| 2012 | 17,466 | 3.8% |
| 2011 | 16,834 | 2.5% |
| 2010 | 16,424 | - |
Race / Ethnicity in Conway
See the full breakdown
Conway is:
62.0% White with 16,911 White residents.
24.7% African American with 6,742 African American residents.
0.1% American Indian with 23 American Indian residents.
1.8% Asian with 494 Asian residents.
0.0% Hawaiian with 0 Hawaiian residents.
2.7% Other with 739 Other residents.
3.2% Two Or More with 886 Two Or More residents.
5.4% Hispanic with 1,468 Hispanic residents.
| Race | Conway | SC | USA |
|---|---|---|---|
| White | 62.0% | 61.9% | 57.4% |
| African American | 24.7% | 24.6% | 11.9% |
| American Indian | 0.1% | 0.2% | 0.5% |
| Asian | 1.8% | 1.7% | 5.9% |
| Hawaiian | 0.0% | 0.0% | 0.2% |
| Other | 2.7% | 0.5% | 0.6% |
| Two Or More | 3.2% | 3.7% | 4.3% |
| Hispanic | 5.4% | 7.4% | 19.3% |
Gender in Conway
See the full breakdown
Conway is 54.8% female with 14,938 female residents.
Conway is 45.2% male with 12,325 male residents.
| Gender | Conway | SC | USA |
|---|---|---|---|
| Female | 54.8% | 51.3% | 50.5% |
| Male | 45.2% | 48.7% | 49.5% |
Highest level of educational attainment in Conway for adults over 25
See the full breakdown
2.0% of adults in Conway completed < 9th grade.
9.0% of adults in Conway completed 9-12th grade.
31.0% of adults in Conway completed high school / ged.
27.0% of adults in Conway completed some college.
11.0% of adults in Conway completed associate's degree.
11.0% of adults in Conway completed bachelor's degree.
7.0% of adults in Conway completed master's degree.
1.0% of adults in Conway completed professional degree.
1.0% of adults in Conway completed doctorate degree.
| Education | Conway | SC | USA |
|---|---|---|---|
| < 9th Grade | 2.0% | 3.0% | 4.0% |
| 9-12th Grade | 9.0% | 7.0% | 6.0% |
| High School / GED | 31.0% | 28.0% | 26.0% |
| Some College | 27.0% | 20.0% | 19.0% |
| Associate's Degree | 11.0% | 10.0% | 9.0% |
| Bachelor's Degree | 11.0% | 20.0% | 22.0% |
| Master's Degree | 7.0% | 9.0% | 10.0% |
| Professional Degree | 1.0% | 2.0% | 2.0% |
| Doctorate Degree | 1.0% | 1.0% | 2.0% |
Household Income For Conway, South Carolina
See the full breakdown
10.0% of households in Conway earn Less than $10,000.
4.2% of households in Conway earn $10,000 to $14,999.
8.8% of households in Conway earn $15,000 to $24,999.
12.6% of households in Conway earn $25,000 to $34,999.
10.1% of households in Conway earn $35,000 to $49,999.
18.1% of households in Conway earn $50,000 to $74,999.
14.2% of households in Conway earn $75,000 to $99,999.
10.4% of households in Conway earn $100,000 to $149,999.
6.6% of households in Conway earn $150,000 to $199,999.
4.9% of households in Conway earn $200,000 or more.
| Income | Conway | SC | USA |
|---|---|---|---|
| Less than $10,000 | 10.0% | 5.9% | 5.0% |
| $10,000 to $14,999 | 4.2% | 3.8% | 3.4% |
| $15,000 to $24,999 | 8.8% | 7.3% | 6.3% |
| $25,000 to $34,999 | 12.6% | 7.7% | 6.6% |
| $35,000 to $49,999 | 10.1% | 11.9% | 10.1% |
| $50,000 to $74,999 | 18.1% | 17.0% | 15.5% |
| $75,000 to $99,999 | 14.2% | 13.1% | 12.6% |
| $100,000 to $149,999 | 10.4% | 16.4% | 17.5% |
| $150,000 to $199,999 | 6.6% | 8.0% | 9.6% |
| $200,000 or more | 4.9% | 8.9% | 13.4% |
Source: U.S. Census ACS 5-year estimates (2024)


