Compare Myrtle Beach to…
Myrtle Beach SnackAbility
Overall SnackAbility
Crime in Myrtle Beach summary. We use data from the FBI to determine the crime rates in Myrtle Beach. Key points include:
There were 2,776 total crimes in Myrtle Beach in the last reporting year.
The overall crime rate per 100,000 people in Myrtle Beach is 6,767.1 / 100k people.
The violent crime rate per 100,000 people in Myrtle Beach is 1,111.6 / 100k people.
The property crime rate per 100,000 people in Myrtle Beach is 5,655.5 / 100k people.
Overall, crime in Myrtle Beach is 219.32% above the national average.
Total Crimes
Above National Average
Crime In Myrtle Beach Comparison Table
| Statistic | Count Raw |
Myrtle Beach / 100k People |
South Carolina / 100k People |
National / 100k People |
|---|---|---|---|---|
| Total Crimes Per 100K | 2,776 | 6,767.1 | 2,402.5 | 2,119.2 |
| Violent Crime | 456 | 1,111.6 | 436.7 | 359.0 |
| Murder | 5 | 12.2 | 7.5 | 5.0 |
| Robbery | 71 | 173.1 | 35.1 | 61.0 |
| Aggravated Assault | 304 | 741.1 | 357.1 | 256.0 |
| Property Crime | 2,320 | 5,655.5 | 1,965.8 | 1,760.0 |
| Burglary | 183 | 446.1 | 282.4 | 229.0 |
| Larceny | 1,975 | 4,814.5 | 1,468.2 | 1,272.0 |
| Car Theft | 162 | 394.9 | 215.1 | 259.0 |
Source: FBI Uniform Crime Reporting (2024)
Cost of living in Myrtle Beach summary. We use data on the cost of living to determine how expensive it is to live in Myrtle Beach. Real estate prices drive most of the variance in cost of living around South Carolina. Key points include:
The cost of living in Myrtle Beach is 106 with 100 being average.
The cost of living in Myrtle Beach is 1.1x higher than the national average.
The median home value in Myrtle Beach is $320,925.
The median income in Myrtle Beach is $60,394.
Myrtle Beach's Overall Cost Of Living
Higher Than The National Average
Cost Of Living In Myrtle Beach Comparison Table
| Living Expense | Myrtle Beach | South Carolina | National Average |
|---|---|---|---|
| Overall | 106 | 92 | 100 |
| Services | 99 | 97 | 100 |
| Groceries | 98 | 96 | 100 |
| Health | 117 | 82 | 100 |
| Housing | 97 | 101 | 100 |
| Transportation | 102 | 101 | 100 |
| Utilities | 98 | 97 | 100 |
Source: Cost of living index, normalized to US average = 100
Myrtle Beach, SC Weather
The average high in Myrtle Beach is 73.0° and the average low is 53.9°.
There are 75.6 days of precipitation each year.
Expect an average of 49.7 inches of precipitation each year with 1.0 inches of snow.
| Stat | Myrtle Beach |
|---|---|
| Average Annual High | 73.0 |
| Average Annual Low | 53.9 |
| Annual Precipitation Days | 75.6 |
| Average Annual Precipitation | 49.7 |
| Average Annual Snowfall | 1.0 |
Average High
Days of Rain
Source: NOAA climate normals (30-year)
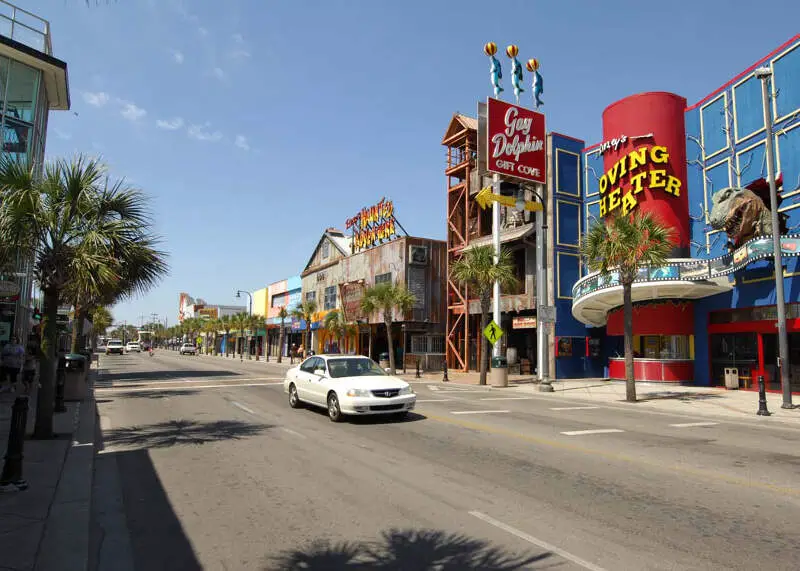
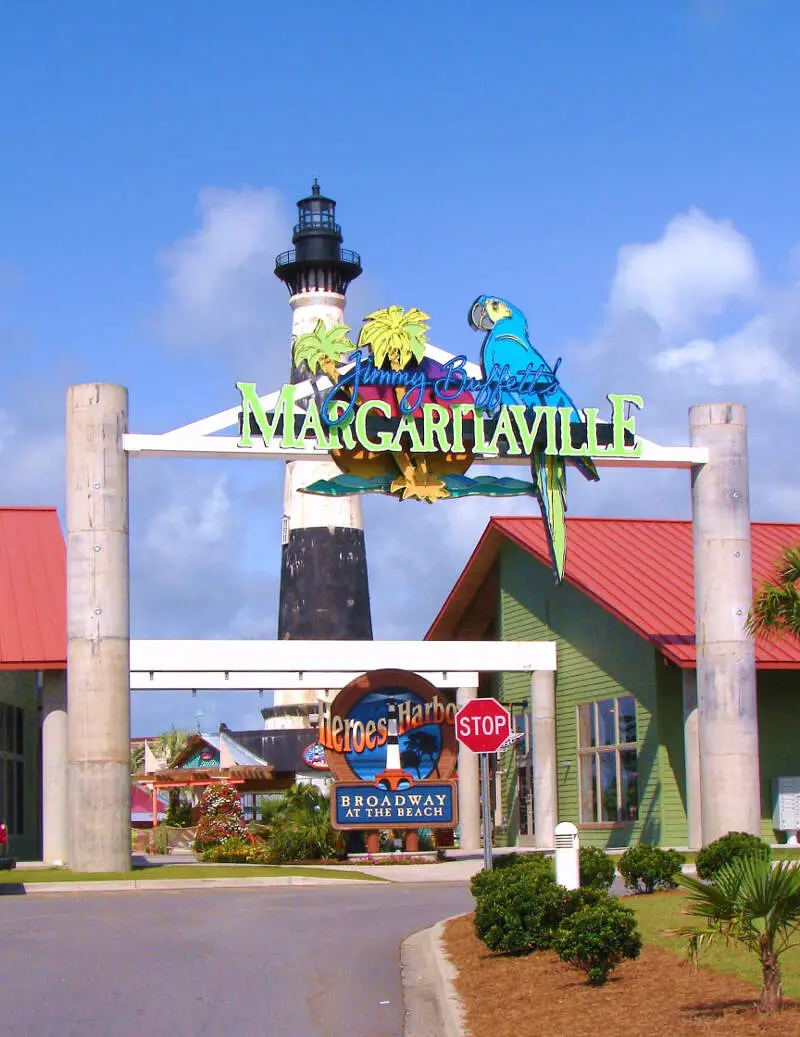
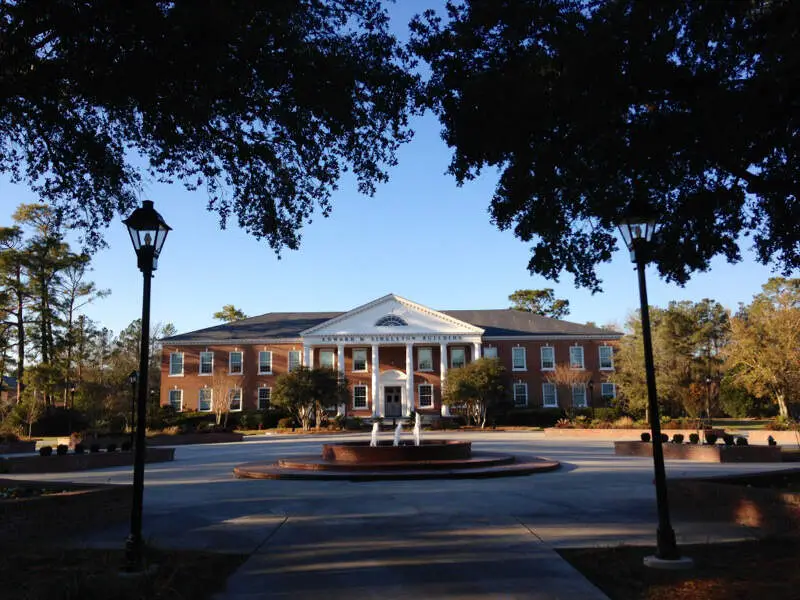
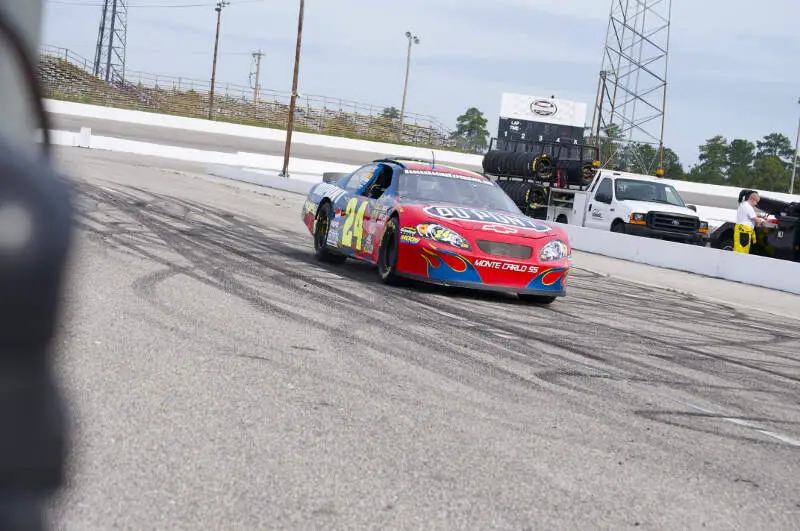
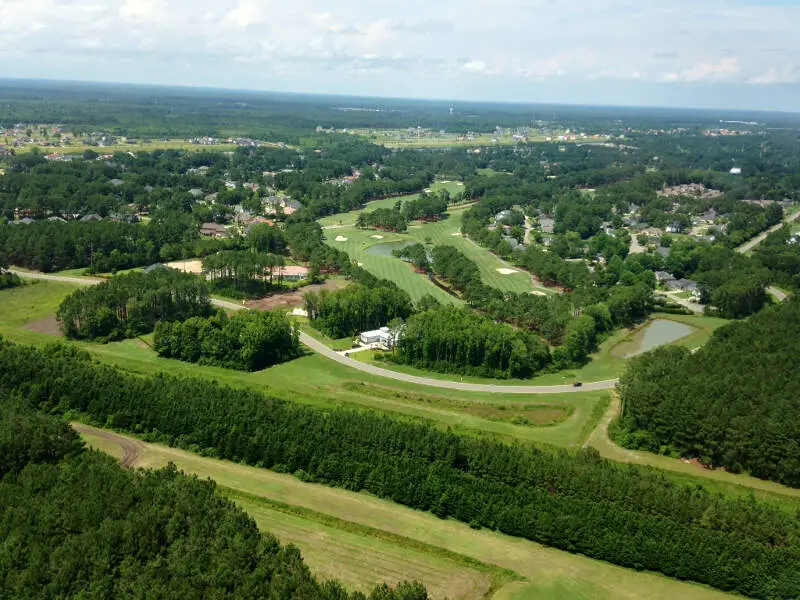
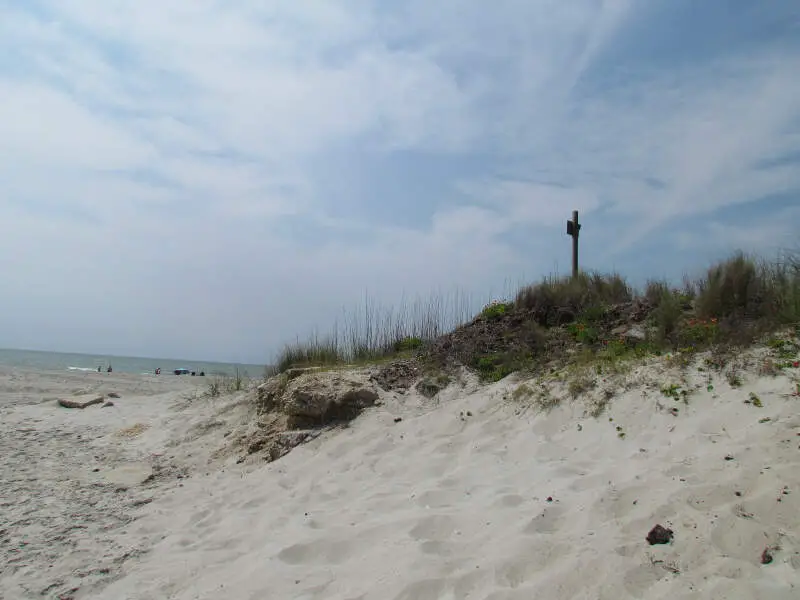
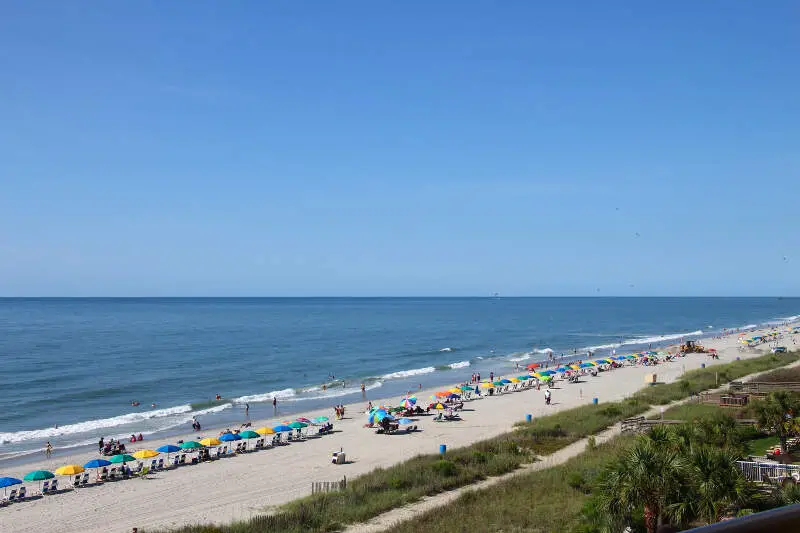
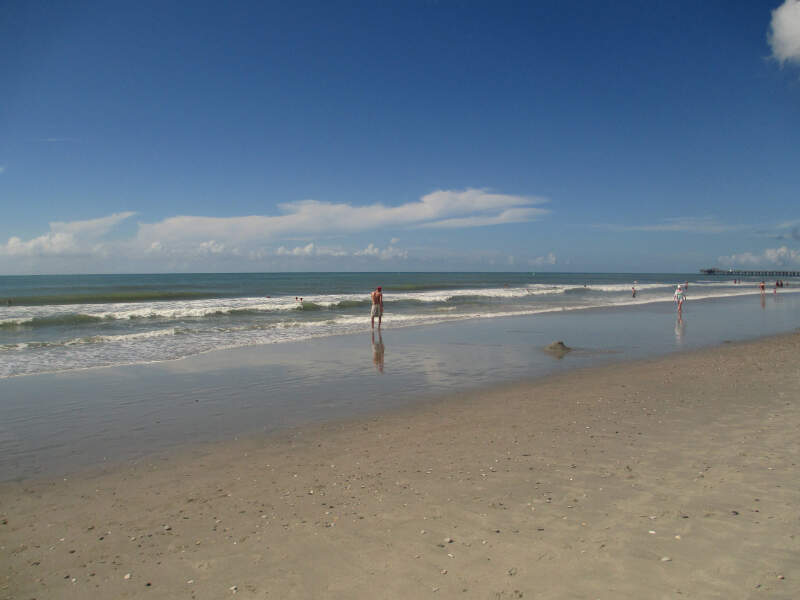
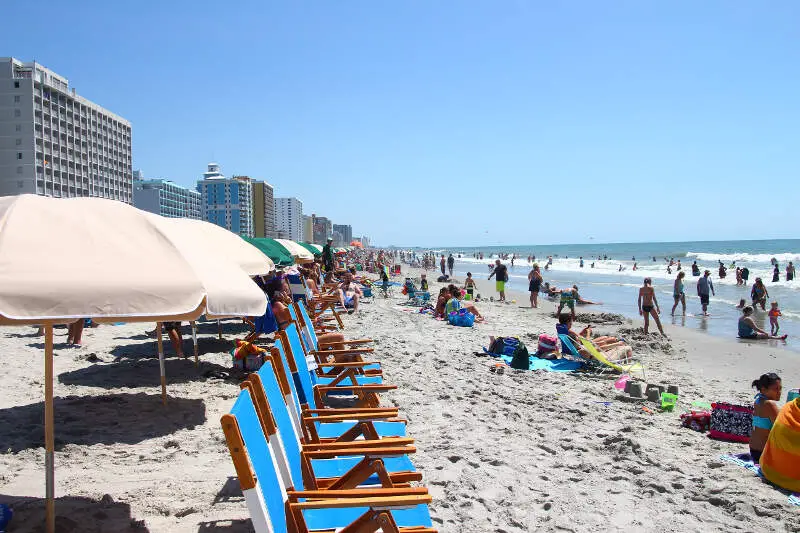
Myrtle Beach, SC Photos
8 Reviews & Comments About Myrtle Beach

I live in Myrtle Beach in the winter. It's wonderful there, and very affordable. You don't have to pay school tax, and property tax is a tenth of what it is in NYS. Myrtle has some of the loveliest neighborhoods I've ever seen, and nearly all neighborhoods are gated, mainly to keep tourists out. If you're not insistant on living right on the beach, you can get a very nice 1 bedroom condo for around $45,000 to $50,000.
You can find perfectly nice 2 bedrooms for under $100K. Where I live is only 5 minutes from the Beach, but it's WAY cheaper than living right on the Grand Strand, which is where the beach is. South Carolina is also one of the most dof-friendly ststes I know. You're even wlcome to bring your dog to the beach to swim and play. That's because people are very good aout cleaning up after their dogs. When my parents eventually pass away, I will move there permanently, and gtfo of NY!
There is a high crime rate and the climate is nearly unbearable in the summer, but all in all it's a nice and fun place to live. The people will keep you laughing and there is always something to do!
Favorite places are all the parks and beaches nearby. Savannah's Playground and the whole Market Common area are fantastic and family friendly.
Myrtle Beach seemed very safe, within normal conditions. Only on vacation so not sure about schools or normal life there, but excellent spot for relaxation.
My favorite place is the beach. I was not interested in a lot of the other things to do, even though there were lots of choices. Watching the sunrise and sunset are the must-dos. Even though beaches can get crowded, early morning and night provide much more solitude. Be sure to stay oceanfront with a view.
Crime was only up during spring break times. Non peak months it is very tranquil. The weather is mostly nice 10 months out of the year. Shops remain open in the mainland all year and most stay open at the beach
The best place to visit is Broadway on the Beach. Has a variety of entertainment that could last the whole day. Stay away from main street during spring break, you'll never get around in a vehicle.
I loved Myrtle Beach. It was like something out of a movie. It is a tourist destination for sure, but there's an ambience and a magical quality to it that is simply unmatched by other places I have been to.
The beach, of course. The food. The emptiness of the off season. The beauty of its location.
Myrtle Beach, SC is a truly horrible place to live. It's a place people go to die. I live in one of the better areas, and in the last 7 years of living here, mine qnd my husband's car have been broken into 3 times...in my driveway! They aren't even "nice" cars! The public school system here is absolutely laughable! The health care system is a joke and jobs are scarcely available during the "off-season". Traffic during the summer is impossible, due to tourism, and with the increased amount of ignorant people, there is a car accident every few miles on any road you travel. You pay tax on EVERYTHING, which makes you wonder where all that money is going, considering the shape of the roads, schools and healthcare system. It's expensive to live here and if you don't like bars or golf or crowded beaches, then you are left with nothing to do. This place is at least 50 years behind the times and if you are not white, it's an even worse place to live.
Broadway at the Beach is a popular tourist attraction. It has lots of shops, Ripley's Aquarium, The Upside Down House, movie theater, clubs, restaurants and bars. During the day, it's a great place for family fun. At night, though, I'd leave the kids at home, unless you don't mind having lots of staggering, loud, unruly drunks talking to and falling down on them.
Myrtle Beach has a very high crime rate which is due to a large flow of tourists through the area. Be safe but enjoy yourself in this touristy city because there are lots of things to do here.
There are many fun things to do in myrtle beach. Is a great place for tourist and families
I've lived here for 35 years and have steadily watched the place turn into Sodom and Gomorra by the sea. Increased crime, poor education, roads forever in disrepair, more bars than churches.
What stands out- The inability for anyone to enter or leave with even the most minor fender bender on 501 because tourists and locals alike clog up traffic far worse than need be.
Rankings & Articles For Myrtle Beach


Locations Around Myrtle Beach
Map Of Myrtle Beach, SC
Best Places Around Myrtle Beach
Murrells Inlet, SC
Population 10,044
Red Hill, SC
Population 15,920
Little River, SC
Population 11,771
Socastee, SC
Population 23,796
North Myrtle Beach, SC
Population 19,855
Conway, SC
Population 27,263
Myrtle Beach Demographics And Statistics
Population over time in Myrtle Beach
The current population in Myrtle Beach is 38,371. The population has increased 43.7% from 2010.
| Year | Population | % Change |
|---|---|---|
| 2024 | 38,371 | 3.1% |
| 2023 | 37,214 | 3.2% |
| 2022 | 36,064 | 2.7% |
| 2021 | 35,116 | 4.4% |
| 2020 | 33,638 | 2.9% |
| 2019 | 32,700 | 2.9% |
| 2018 | 31,783 | 3.3% |
| 2017 | 30,760 | 2.2% |
| 2016 | 30,106 | 3.1% |
| 2015 | 29,198 | 2.6% |
| 2014 | 28,455 | 2.0% |
| 2013 | 27,884 | 1.6% |
| 2012 | 27,433 | 1.2% |
| 2011 | 27,097 | 1.5% |
| 2010 | 26,696 | - |
Race / Ethnicity in Myrtle Beach
See the full breakdown
Myrtle Beach is:
65.6% White with 25,170 White residents.
14.7% African American with 5,646 African American residents.
0.1% American Indian with 32 American Indian residents.
1.2% Asian with 444 Asian residents.
0.0% Hawaiian with 17 Hawaiian residents.
0.2% Other with 90 Other residents.
5.0% Two Or More with 1,909 Two Or More residents.
13.2% Hispanic with 5,063 Hispanic residents.
| Race | Myrtle Beach | SC | USA |
|---|---|---|---|
| White | 65.6% | 61.9% | 57.4% |
| African American | 14.7% | 24.6% | 11.9% |
| American Indian | 0.1% | 0.2% | 0.5% |
| Asian | 1.2% | 1.7% | 5.9% |
| Hawaiian | 0.0% | 0.0% | 0.2% |
| Other | 0.2% | 0.5% | 0.6% |
| Two Or More | 5.0% | 3.7% | 4.3% |
| Hispanic | 13.2% | 7.4% | 19.3% |
Gender in Myrtle Beach
See the full breakdown
Myrtle Beach is 50.7% female with 19,456 female residents.
Myrtle Beach is 49.3% male with 18,915 male residents.
| Gender | Myrtle Beach | SC | USA |
|---|---|---|---|
| Female | 50.7% | 51.3% | 50.5% |
| Male | 49.3% | 48.7% | 49.5% |
Highest level of educational attainment in Myrtle Beach for adults over 25
See the full breakdown
2.0% of adults in Myrtle Beach completed < 9th grade.
5.0% of adults in Myrtle Beach completed 9-12th grade.
28.0% of adults in Myrtle Beach completed high school / ged.
21.0% of adults in Myrtle Beach completed some college.
10.0% of adults in Myrtle Beach completed associate's degree.
21.0% of adults in Myrtle Beach completed bachelor's degree.
8.0% of adults in Myrtle Beach completed master's degree.
3.0% of adults in Myrtle Beach completed professional degree.
2.0% of adults in Myrtle Beach completed doctorate degree.
| Education | Myrtle Beach | SC | USA |
|---|---|---|---|
| < 9th Grade | 2.0% | 3.0% | 4.0% |
| 9-12th Grade | 5.0% | 7.0% | 6.0% |
| High School / GED | 28.0% | 28.0% | 26.0% |
| Some College | 21.0% | 20.0% | 19.0% |
| Associate's Degree | 10.0% | 10.0% | 9.0% |
| Bachelor's Degree | 21.0% | 20.0% | 22.0% |
| Master's Degree | 8.0% | 9.0% | 10.0% |
| Professional Degree | 3.0% | 2.0% | 2.0% |
| Doctorate Degree | 2.0% | 1.0% | 2.0% |
Household Income For Myrtle Beach, South Carolina
See the full breakdown
6.3% of households in Myrtle Beach earn Less than $10,000.
4.9% of households in Myrtle Beach earn $10,000 to $14,999.
10.4% of households in Myrtle Beach earn $15,000 to $24,999.
9.5% of households in Myrtle Beach earn $25,000 to $34,999.
13.6% of households in Myrtle Beach earn $35,000 to $49,999.
14.2% of households in Myrtle Beach earn $50,000 to $74,999.
11.0% of households in Myrtle Beach earn $75,000 to $99,999.
14.7% of households in Myrtle Beach earn $100,000 to $149,999.
6.3% of households in Myrtle Beach earn $150,000 to $199,999.
9.2% of households in Myrtle Beach earn $200,000 or more.
| Income | Myrtle Beach | SC | USA |
|---|---|---|---|
| Less than $10,000 | 6.3% | 5.9% | 5.0% |
| $10,000 to $14,999 | 4.9% | 3.8% | 3.4% |
| $15,000 to $24,999 | 10.4% | 7.3% | 6.3% |
| $25,000 to $34,999 | 9.5% | 7.7% | 6.6% |
| $35,000 to $49,999 | 13.6% | 11.9% | 10.1% |
| $50,000 to $74,999 | 14.2% | 17.0% | 15.5% |
| $75,000 to $99,999 | 11.0% | 13.1% | 12.6% |
| $100,000 to $149,999 | 14.7% | 16.4% | 17.5% |
| $150,000 to $199,999 | 6.3% | 8.0% | 9.6% |
| $200,000 or more | 9.2% | 8.9% | 13.4% |
Source: U.S. Census ACS 5-year estimates (2024)


