Fort Mill SnackAbility
Overall SnackAbility
Crime in Fort Mill summary. We use data from the FBI to determine the crime rates in Fort Mill. Key points include:
There were 251 total crimes in Fort Mill in the last reporting year.
The overall crime rate per 100,000 people in Fort Mill is 677.9 / 100k people.
The violent crime rate per 100,000 people in Fort Mill is 45.9 / 100k people.
The property crime rate per 100,000 people in Fort Mill is 632.0 / 100k people.
Overall, crime in Fort Mill is -68.01% below the national average.
Total Crimes
Below National Average
Crime In Fort Mill Comparison Table
| Statistic | Count Raw |
Fort Mill / 100k People |
South Carolina / 100k People |
National / 100k People |
|---|---|---|---|---|
| Total Crimes Per 100K | 251 | 677.9 | 2,402.5 | 2,119.2 |
| Violent Crime | 17 | 45.9 | 436.7 | 359.0 |
| Murder | 0 | 0.0 | 7.5 | 5.0 |
| Robbery | 3 | 8.1 | 35.1 | 61.0 |
| Aggravated Assault | 9 | 24.3 | 357.1 | 256.0 |
| Property Crime | 234 | 632.0 | 1,965.8 | 1,760.0 |
| Burglary | 16 | 43.2 | 282.4 | 229.0 |
| Larceny | 205 | 553.7 | 1,468.2 | 1,272.0 |
| Car Theft | 13 | 35.1 | 215.1 | 259.0 |
Source: FBI Uniform Crime Reporting (2024)
Cost of living in Fort Mill summary. We use data on the cost of living to determine how expensive it is to live in Fort Mill. Real estate prices drive most of the variance in cost of living around South Carolina. Key points include:
The cost of living in Fort Mill is 116 with 100 being average.
The cost of living in Fort Mill is 1.2x higher than the national average.
The median home value in Fort Mill is $527,208.
The median income in Fort Mill is $121,823.
Fort Mill's Overall Cost Of Living
Higher Than The National Average
Cost Of Living In Fort Mill Comparison Table
| Living Expense | Fort Mill | South Carolina | National Average |
|---|---|---|---|
| Overall | 116 | 92 | 100 |
| Services | 97 | 97 | 100 |
| Groceries | 99 | 96 | 100 |
| Health | 155 | 82 | 100 |
| Housing | 99 | 101 | 100 |
| Transportation | 103 | 101 | 100 |
| Utilities | 101 | 97 | 100 |
Source: Cost of living index, normalized to US average = 100
Fort Mill, SC Weather
The average high in Fort Mill is 72.0° and the average low is 49.2°.
There are 69.6 days of precipitation each year.
Expect an average of 44.3 inches of precipitation each year with 2.1 inches of snow.
| Stat | Fort Mill |
|---|---|
| Average Annual High | 72.0 |
| Average Annual Low | 49.2 |
| Annual Precipitation Days | 69.6 |
| Average Annual Precipitation | 44.3 |
| Average Annual Snowfall | 2.1 |
Average High
Days of Rain
Source: NOAA climate normals (30-year)
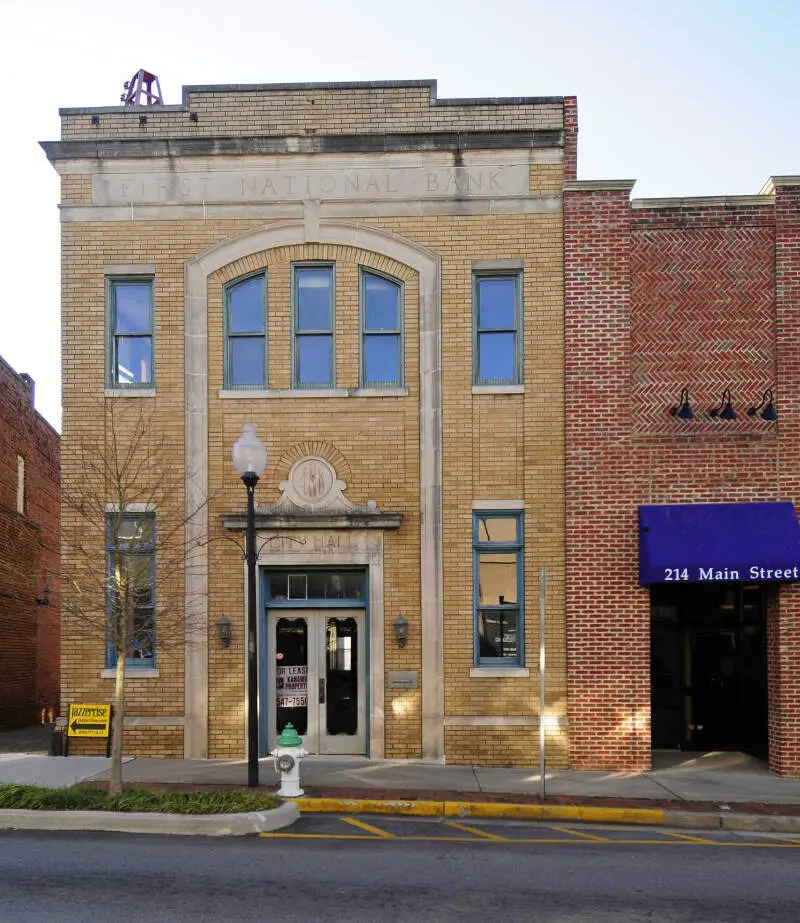
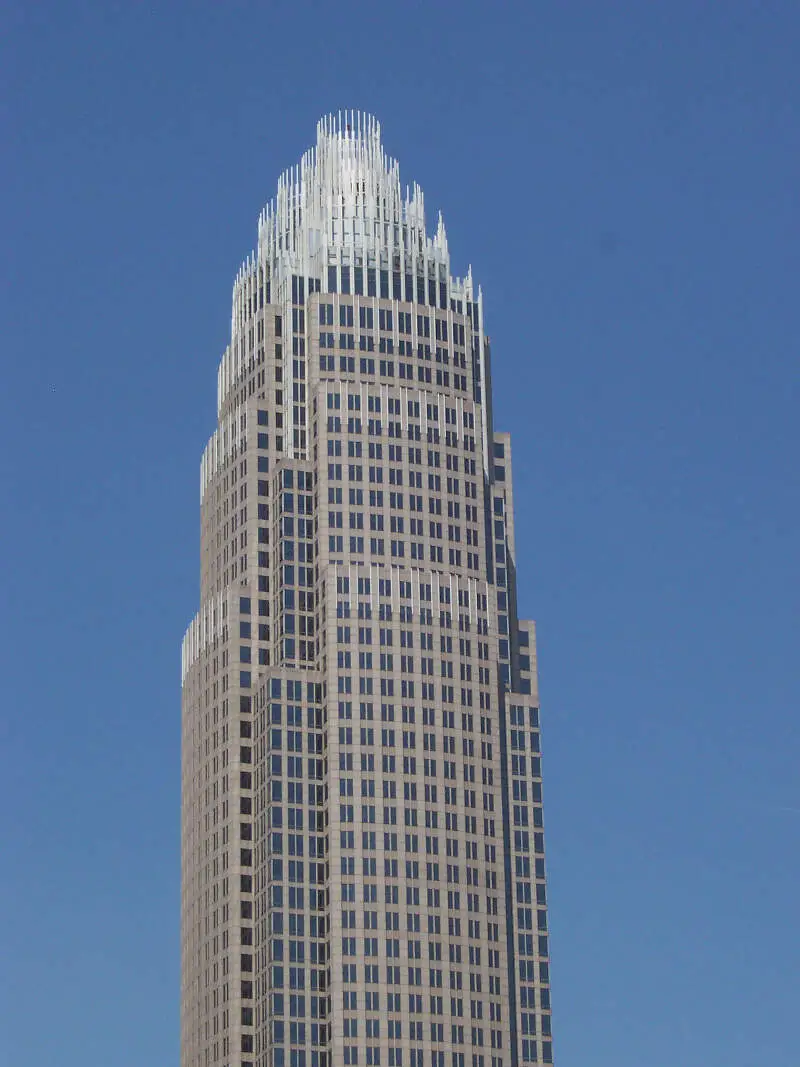
Fort Mill, SC Photos
Rankings & Articles For Fort Mill


Locations Around Fort Mill
Map Of Fort Mill, SC
Best Places Around Fort Mill
Matthews, NC
Population 30,577
Marvin, NC
Population 6,692
Stallings, NC
Population 16,886
Indian Trail, NC
Population 42,036
Wesley Chapel, NC
Population 9,090
Weddington, NC
Population 13,805
Charlotte, NC
Population 903,844
Mint Hill, NC
Population 27,556
Waxhaw, NC
Population 22,275
Tega Cay, SC
Population 13,615
Fort Mill Demographics And Statistics
Population over time in Fort Mill
The current population in Fort Mill is 30,775. The population has increased 199.6% from 2010.
| Year | Population | % Change |
|---|---|---|
| 2024 | 30,775 | 8.8% |
| 2023 | 28,281 | 8.7% |
| 2022 | 26,022 | 8.1% |
| 2021 | 24,069 | 20.8% |
| 2020 | 19,920 | 12.6% |
| 2019 | 17,692 | 11.1% |
| 2018 | 15,924 | 10.2% |
| 2017 | 14,451 | 9.6% |
| 2016 | 13,181 | 5.2% |
| 2015 | 12,525 | 3.8% |
| 2014 | 12,068 | 3.6% |
| 2013 | 11,653 | 6.8% |
| 2012 | 10,912 | 3.0% |
| 2011 | 10,597 | 3.2% |
| 2010 | 10,273 | - |
Race / Ethnicity in Fort Mill
See the full breakdown
Fort Mill is:
70.7% White with 21,749 White residents.
12.8% African American with 3,947 African American residents.
0.1% American Indian with 16 American Indian residents.
5.5% Asian with 1,697 Asian residents.
0.0% Hawaiian with 0 Hawaiian residents.
0.7% Other with 203 Other residents.
4.7% Two Or More with 1,451 Two Or More residents.
5.6% Hispanic with 1,712 Hispanic residents.
| Race | Fort Mill | SC | USA |
|---|---|---|---|
| White | 70.7% | 61.9% | 57.4% |
| African American | 12.8% | 24.6% | 11.9% |
| American Indian | 0.1% | 0.2% | 0.5% |
| Asian | 5.5% | 1.7% | 5.9% |
| Hawaiian | 0.0% | 0.0% | 0.2% |
| Other | 0.7% | 0.5% | 0.6% |
| Two Or More | 4.7% | 3.7% | 4.3% |
| Hispanic | 5.6% | 7.4% | 19.3% |
Gender in Fort Mill
See the full breakdown
Fort Mill is 51.5% female with 15,836 female residents.
Fort Mill is 48.5% male with 14,939 male residents.
| Gender | Fort Mill | SC | USA |
|---|---|---|---|
| Female | 51.5% | 51.3% | 50.5% |
| Male | 48.5% | 48.7% | 49.5% |
Highest level of educational attainment in Fort Mill for adults over 25
See the full breakdown
-1.0% of adults in Fort Mill completed < 9th grade.
2.0% of adults in Fort Mill completed 9-12th grade.
15.0% of adults in Fort Mill completed high school / ged.
14.0% of adults in Fort Mill completed some college.
11.0% of adults in Fort Mill completed associate's degree.
37.0% of adults in Fort Mill completed bachelor's degree.
17.0% of adults in Fort Mill completed master's degree.
3.0% of adults in Fort Mill completed professional degree.
2.0% of adults in Fort Mill completed doctorate degree.
| Education | Fort Mill | SC | USA |
|---|---|---|---|
| < 9th Grade | -1.0% | 3.0% | 4.0% |
| 9-12th Grade | 2.0% | 7.0% | 6.0% |
| High School / GED | 15.0% | 28.0% | 26.0% |
| Some College | 14.0% | 20.0% | 19.0% |
| Associate's Degree | 11.0% | 10.0% | 9.0% |
| Bachelor's Degree | 37.0% | 20.0% | 22.0% |
| Master's Degree | 17.0% | 9.0% | 10.0% |
| Professional Degree | 3.0% | 2.0% | 2.0% |
| Doctorate Degree | 2.0% | 1.0% | 2.0% |
Household Income For Fort Mill, South Carolina
See the full breakdown
2.6% of households in Fort Mill earn Less than $10,000.
0.8% of households in Fort Mill earn $10,000 to $14,999.
2.5% of households in Fort Mill earn $15,000 to $24,999.
3.3% of households in Fort Mill earn $25,000 to $34,999.
5.4% of households in Fort Mill earn $35,000 to $49,999.
12.5% of households in Fort Mill earn $50,000 to $74,999.
13.5% of households in Fort Mill earn $75,000 to $99,999.
20.1% of households in Fort Mill earn $100,000 to $149,999.
16.5% of households in Fort Mill earn $150,000 to $199,999.
22.7% of households in Fort Mill earn $200,000 or more.
| Income | Fort Mill | SC | USA |
|---|---|---|---|
| Less than $10,000 | 2.6% | 5.9% | 5.0% |
| $10,000 to $14,999 | 0.8% | 3.8% | 3.4% |
| $15,000 to $24,999 | 2.5% | 7.3% | 6.3% |
| $25,000 to $34,999 | 3.3% | 7.7% | 6.6% |
| $35,000 to $49,999 | 5.4% | 11.9% | 10.1% |
| $50,000 to $74,999 | 12.5% | 17.0% | 15.5% |
| $75,000 to $99,999 | 13.5% | 13.1% | 12.6% |
| $100,000 to $149,999 | 20.1% | 16.4% | 17.5% |
| $150,000 to $199,999 | 16.5% | 8.0% | 9.6% |
| $200,000 or more | 22.7% | 8.9% | 13.4% |
Source: U.S. Census ACS 5-year estimates (2024)


