Clarksville SnackAbility
Overall SnackAbility
Crime in Clarksville summary. We use data from the FBI to determine the crime rates in Clarksville. Key points include:
There were 3,785 total crimes in Clarksville in the last reporting year.
The overall crime rate per 100,000 people in Clarksville is 2,042.1 / 100k people.
The violent crime rate per 100,000 people in Clarksville is 410.0 / 100k people.
The property crime rate per 100,000 people in Clarksville is 1,632.1 / 100k people.
Overall, crime in Clarksville is -3.64% below the national average.
Total Crimes
Below National Average
Crime In Clarksville Comparison Table
| Statistic | Count Raw |
Clarksville / 100k People |
Tennessee / 100k People |
National / 100k People |
|---|---|---|---|---|
| Total Crimes Per 100K | 3,785 | 2,042.1 | 2,624.4 | 2,119.2 |
| Violent Crime | 760 | 410.0 | 592.3 | 359.0 |
| Murder | 9 | 4.9 | 7.9 | 5.0 |
| Robbery | 43 | 23.2 | 58.4 | 61.0 |
| Aggravated Assault | 607 | 327.5 | 488.6 | 256.0 |
| Property Crime | 3,025 | 1,632.1 | 2,032.1 | 1,760.0 |
| Burglary | 373 | 201.2 | 251.8 | 229.0 |
| Larceny | 2,314 | 1,248.5 | 1,443.6 | 1,272.0 |
| Car Theft | 338 | 182.4 | 336.7 | 259.0 |
Source: FBI Uniform Crime Reporting (2024)
Cost of living in Clarksville summary. We use data on the cost of living to determine how expensive it is to live in Clarksville. Real estate prices drive most of the variance in cost of living around Tennessee. Key points include:
The cost of living in Clarksville is 97 with 100 being average.
The cost of living in Clarksville is 1.0x lower than the national average.
The median home value in Clarksville is $318,205.
The median income in Clarksville is $69,303.
Clarksville's Overall Cost Of Living
Lower Than The National Average
Cost Of Living In Clarksville Comparison Table
| Living Expense | Clarksville | Tennessee | National Average |
|---|---|---|---|
| Overall | 97 | 94 | 100 |
| Services | 95 | 99 | 100 |
| Groceries | 95 | 96 | 100 |
| Health | 95 | 82 | 100 |
| Housing | 97 | 95 | 100 |
| Transportation | 100 | 99 | 100 |
| Utilities | 100 | 98 | 100 |
Source: Cost of living index, normalized to US average = 100
Clarksville, TN Weather
The average high in Clarksville is 69.0° and the average low is 46.6°.
There are 80.8 days of precipitation each year.
Expect an average of 51.0 inches of precipitation each year with 3.4 inches of snow.
| Stat | Clarksville |
|---|---|
| Average Annual High | 69.0 |
| Average Annual Low | 46.6 |
| Annual Precipitation Days | 80.8 |
| Average Annual Precipitation | 51.0 |
| Average Annual Snowfall | 3.4 |
Average High
Days of Rain
Source: NOAA climate normals (30-year)
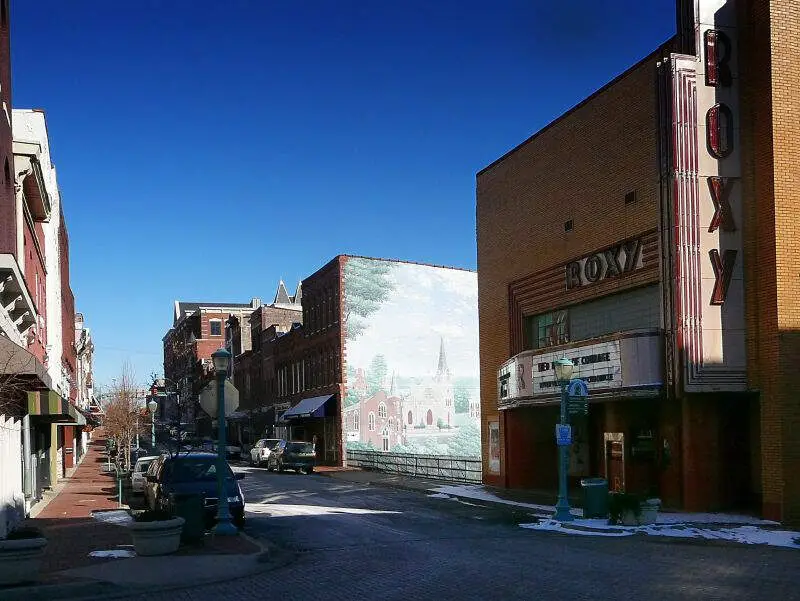
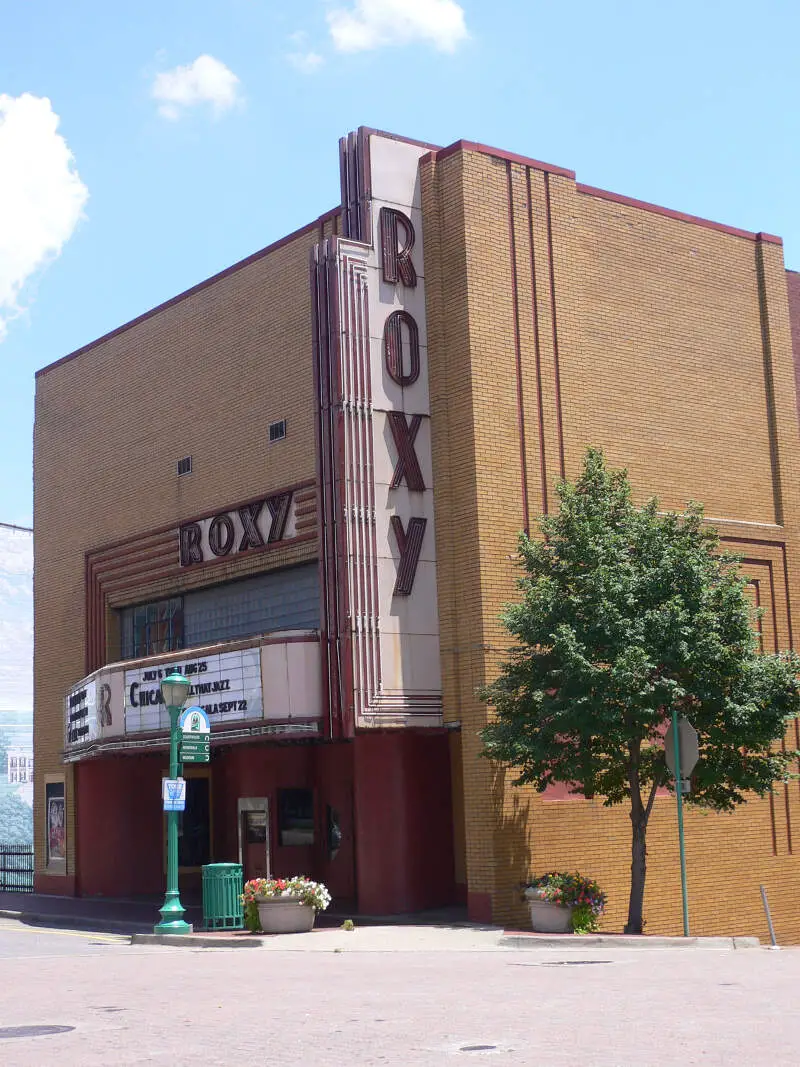
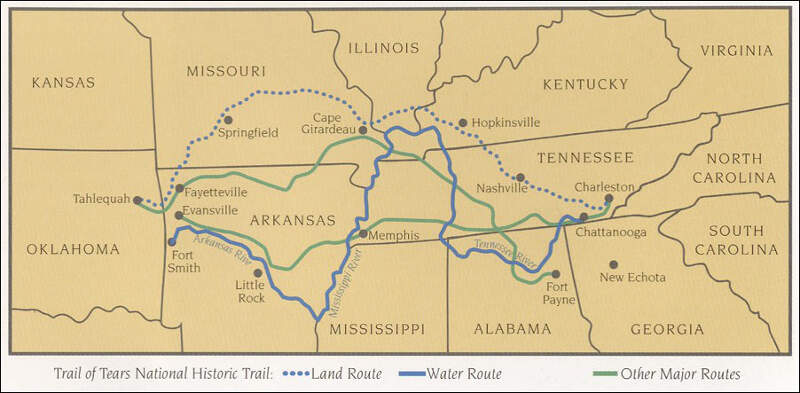
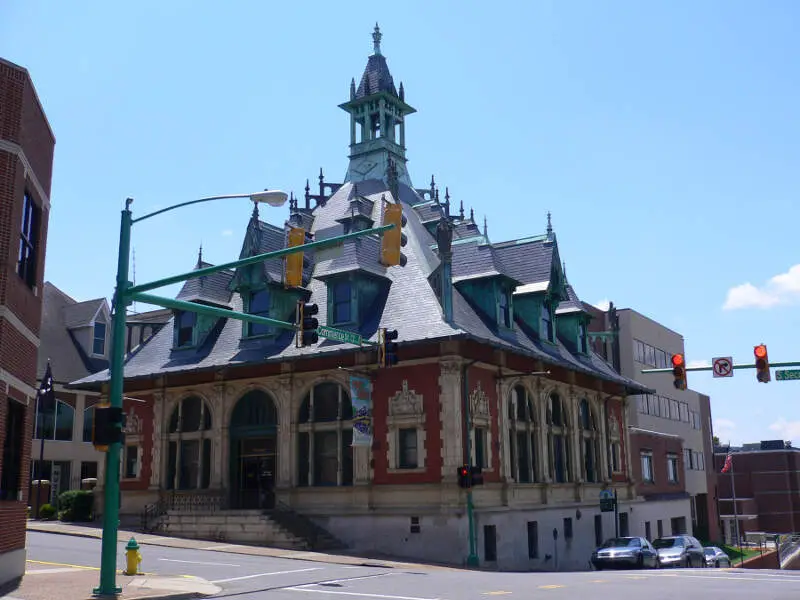
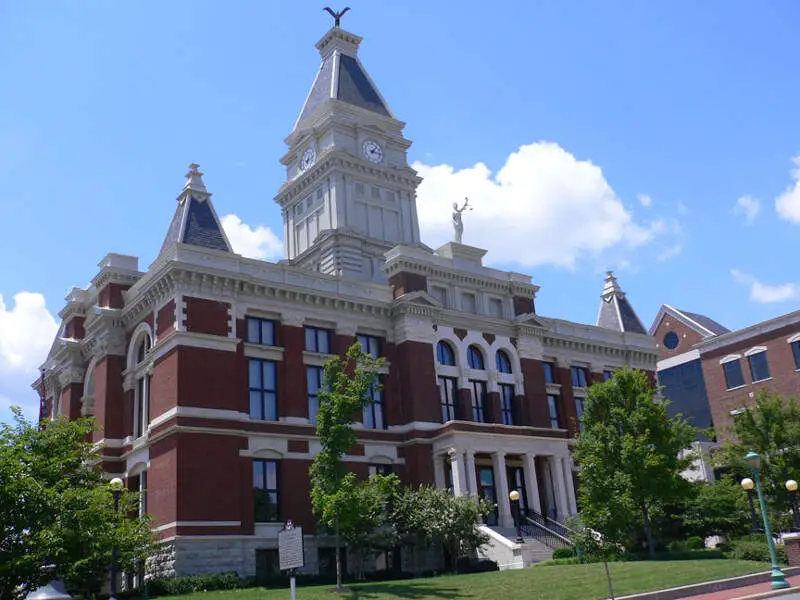
Clarksville, TN Photos


2 Reviews & Comments About Clarksville

I live in Clarksville and pit bulls and m**h usually go together here! Lmbo !,!,!, I know it's sad! If you sell or do drugs you own it least one or more.
The schools are very political and there is a lot of gossip even on the kindergarden level. the crime was not bad it just has a over flow of pot and people that can not drive right leading to accidents
There is not much for teenagers to do there is a public swimming pool that is decent
Rankings & Articles For Clarksville


Locations Around Clarksville
Map Of Clarksville, TN
Best Places Around Clarksville
Green Hill, TN
Population 6,866
Hendersonville, TN
Population 63,091
White House, TN
Population 14,631
Millersville, TN
Population 5,836
Greenbrier, TN
Population 6,971
Portland, TN
Population 13,449
Goodlettsville, TN
Population 17,597
Princeton, KY
Population 6,241
Clarksville Demographics And Statistics
Population over time in Clarksville
The current population in Clarksville is 176,456. The population has increased 39.9% from 2010.
| Year | Population | % Change |
|---|---|---|
| 2024 | 176,456 | 2.7% |
| 2023 | 171,897 | 2.4% |
| 2022 | 167,882 | 2.7% |
| 2021 | 163,518 | 4.8% |
| 2020 | 156,092 | 2.1% |
| 2019 | 152,934 | 1.5% |
| 2018 | 150,602 | 1.9% |
| 2017 | 147,771 | 1.0% |
| 2016 | 146,281 | 1.9% |
| 2015 | 143,618 | 2.2% |
| 2014 | 140,563 | 2.5% |
| 2013 | 137,145 | 2.7% |
| 2012 | 133,583 | 2.9% |
| 2011 | 129,778 | 2.9% |
| 2010 | 126,148 | - |
Race / Ethnicity in Clarksville
See the full breakdown
Clarksville is:
54.6% White with 96,320 White residents.
21.8% African American with 38,547 African American residents.
0.1% American Indian with 236 American Indian residents.
2.5% Asian with 4,410 Asian residents.
0.4% Hawaiian with 649 Hawaiian residents.
0.5% Other with 923 Other residents.
7.2% Two Or More with 12,644 Two Or More residents.
12.9% Hispanic with 22,727 Hispanic residents.
| Race | Clarksville | TN | USA |
|---|---|---|---|
| White | 54.6% | 71.0% | 57.4% |
| African American | 21.8% | 15.4% | 11.9% |
| American Indian | 0.1% | 0.1% | 0.5% |
| Asian | 2.5% | 1.9% | 5.9% |
| Hawaiian | 0.4% | 0.1% | 0.2% |
| Other | 0.5% | 0.4% | 0.6% |
| Two Or More | 7.2% | 3.7% | 4.3% |
| Hispanic | 12.9% | 7.4% | 19.3% |
Gender in Clarksville
See the full breakdown
Clarksville is 49.9% female with 88,109 female residents.
Clarksville is 50.1% male with 88,346 male residents.
| Gender | Clarksville | TN | USA |
|---|---|---|---|
| Female | 49.9% | 50.9% | 50.5% |
| Male | 50.1% | 49.1% | 49.5% |
Highest level of educational attainment in Clarksville for adults over 25
See the full breakdown
2.0% of adults in Clarksville completed < 9th grade.
4.0% of adults in Clarksville completed 9-12th grade.
27.0% of adults in Clarksville completed high school / ged.
25.0% of adults in Clarksville completed some college.
12.0% of adults in Clarksville completed associate's degree.
19.0% of adults in Clarksville completed bachelor's degree.
9.0% of adults in Clarksville completed master's degree.
1.0% of adults in Clarksville completed professional degree.
1.0% of adults in Clarksville completed doctorate degree.
| Education | Clarksville | TN | USA |
|---|---|---|---|
| < 9th Grade | 2.0% | 4.0% | 4.0% |
| 9-12th Grade | 4.0% | 6.0% | 6.0% |
| High School / GED | 27.0% | 31.0% | 26.0% |
| Some College | 25.0% | 20.0% | 19.0% |
| Associate's Degree | 12.0% | 8.0% | 9.0% |
| Bachelor's Degree | 19.0% | 19.0% | 22.0% |
| Master's Degree | 9.0% | 8.0% | 10.0% |
| Professional Degree | 1.0% | 2.0% | 2.0% |
| Doctorate Degree | 1.0% | 2.0% | 2.0% |
Household Income For Clarksville, Tennessee
See the full breakdown
5.4% of households in Clarksville earn Less than $10,000.
2.4% of households in Clarksville earn $10,000 to $14,999.
4.9% of households in Clarksville earn $15,000 to $24,999.
7.3% of households in Clarksville earn $25,000 to $34,999.
13.0% of households in Clarksville earn $35,000 to $49,999.
21.1% of households in Clarksville earn $50,000 to $74,999.
16.4% of households in Clarksville earn $75,000 to $99,999.
18.0% of households in Clarksville earn $100,000 to $149,999.
7.3% of households in Clarksville earn $150,000 to $199,999.
4.2% of households in Clarksville earn $200,000 or more.
| Income | Clarksville | TN | USA |
|---|---|---|---|
| Less than $10,000 | 5.4% | 5.2% | 5.0% |
| $10,000 to $14,999 | 2.4% | 4.0% | 3.4% |
| $15,000 to $24,999 | 4.9% | 7.4% | 6.3% |
| $25,000 to $34,999 | 7.3% | 7.4% | 6.6% |
| $35,000 to $49,999 | 13.0% | 12.0% | 10.1% |
| $50,000 to $74,999 | 21.1% | 17.3% | 15.5% |
| $75,000 to $99,999 | 16.4% | 13.2% | 12.6% |
| $100,000 to $149,999 | 18.0% | 16.8% | 17.5% |
| $150,000 to $199,999 | 7.3% | 7.7% | 9.6% |
| $200,000 or more | 4.2% | 9.0% | 13.4% |
Source: U.S. Census ACS 5-year estimates (2024)


