Franklin SnackAbility
Overall SnackAbility
Crime in Franklin summary. We use data from the FBI to determine the crime rates in Franklin. Key points include:
There were 968 total crimes in Franklin in the last reporting year.
The overall crime rate per 100,000 people in Franklin is 1,074.6 / 100k people.
The violent crime rate per 100,000 people in Franklin is 132.1 / 100k people.
The property crime rate per 100,000 people in Franklin is 942.5 / 100k people.
Overall, crime in Franklin is -49.29% below the national average.
Total Crimes
Below National Average
Crime In Franklin Comparison Table
| Statistic | Count Raw |
Franklin / 100k People |
Tennessee / 100k People |
National / 100k People |
|---|---|---|---|---|
| Total Crimes Per 100K | 968 | 1,074.6 | 2,624.4 | 2,119.2 |
| Violent Crime | 119 | 132.1 | 592.3 | 359.0 |
| Murder | 1 | 1.1 | 7.9 | 5.0 |
| Robbery | 6 | 6.7 | 58.4 | 61.0 |
| Aggravated Assault | 100 | 111.0 | 488.6 | 256.0 |
| Property Crime | 849 | 942.5 | 2,032.1 | 1,760.0 |
| Burglary | 36 | 40.0 | 251.8 | 229.0 |
| Larceny | 747 | 829.3 | 1,443.6 | 1,272.0 |
| Car Theft | 66 | 73.3 | 336.7 | 259.0 |
Source: FBI Uniform Crime Reporting (2024)
Cost of living in Franklin summary. We use data on the cost of living to determine how expensive it is to live in Franklin. Real estate prices drive most of the variance in cost of living around Tennessee. Key points include:
The cost of living in Franklin is 134 with 100 being average.
The cost of living in Franklin is 1.3x higher than the national average.
The median home value in Franklin is $922,855.
The median income in Franklin is $119,528.
Franklin's Overall Cost Of Living
Higher Than The National Average
Cost Of Living In Franklin Comparison Table
| Living Expense | Franklin | Tennessee | National Average |
|---|---|---|---|
| Overall | 134 | 94 | 100 |
| Services | 97 | 99 | 100 |
| Groceries | 98 | 96 | 100 |
| Health | 214 | 82 | 100 |
| Housing | 100 | 95 | 100 |
| Transportation | 99 | 99 | 100 |
| Utilities | 93 | 98 | 100 |
Source: Cost of living index, normalized to US average = 100
Franklin, TN Weather
The average high in Franklin is 69.3° and the average low is 46.3°.
There are 79.6 days of precipitation each year.
Expect an average of 52.5 inches of precipitation each year with 2.5 inches of snow.
| Stat | Franklin |
|---|---|
| Average Annual High | 69.3 |
| Average Annual Low | 46.3 |
| Annual Precipitation Days | 79.6 |
| Average Annual Precipitation | 52.5 |
| Average Annual Snowfall | 2.5 |
Average High
Days of Rain
Source: NOAA climate normals (30-year)
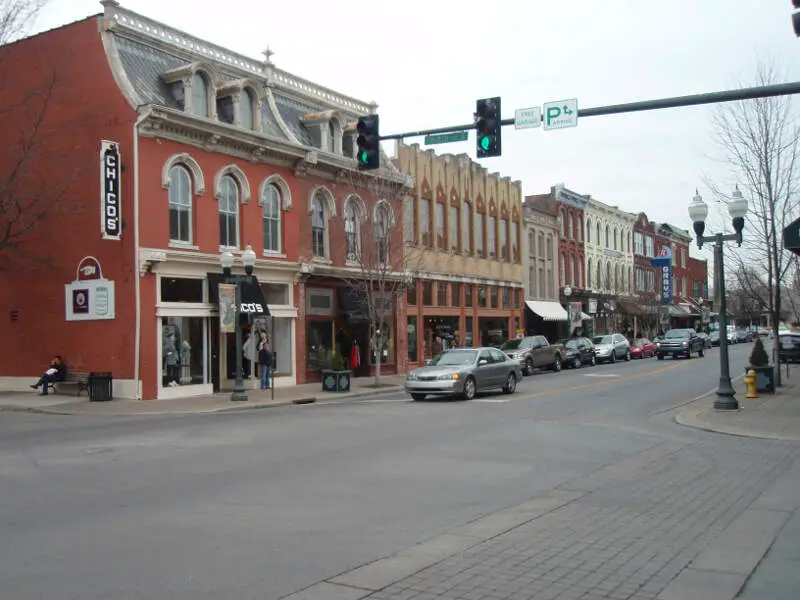
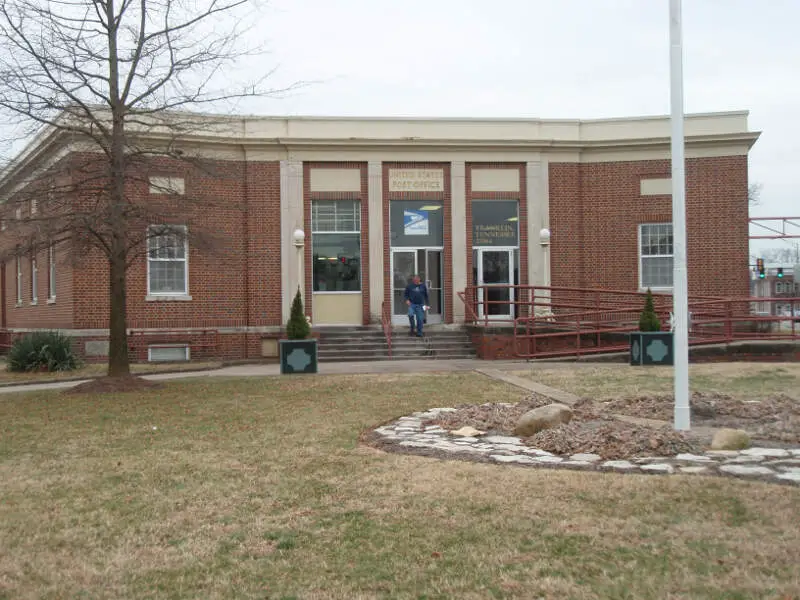
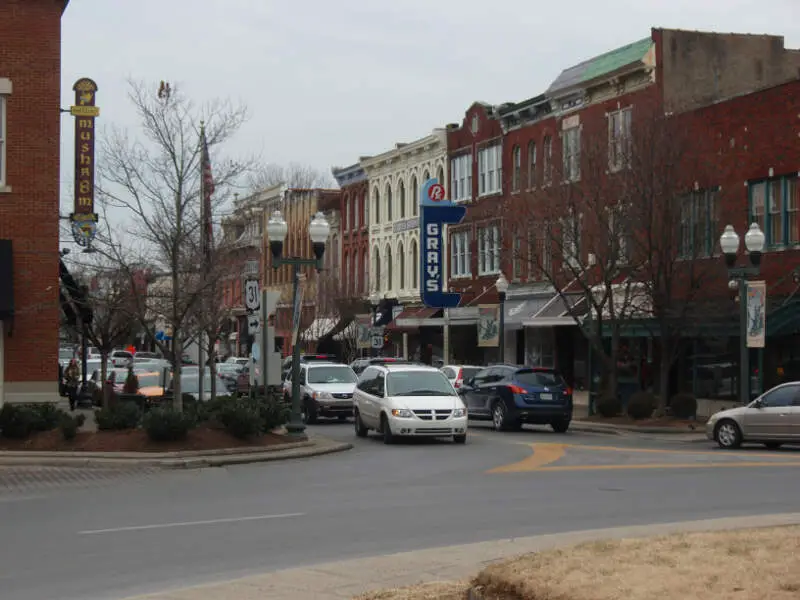
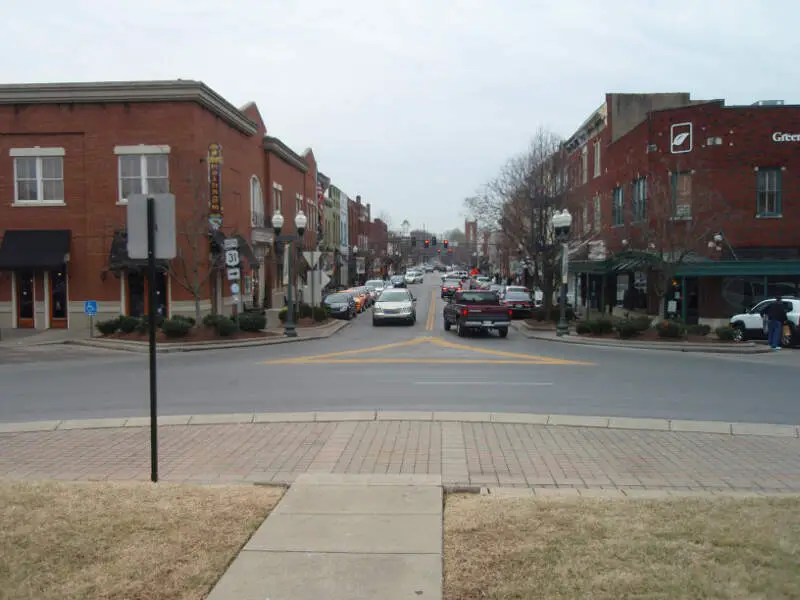
Franklin, TN Photos
1 Reviews & Comments About Franklin

I live in Franklin and you make us out to look like inbred hicks who can't read. Were nice people and Tennessee is a really pretty state so please don't bash us
Rankings & Articles For Franklin


Locations Around Franklin
Map Of Franklin, TN
Best Places Around Franklin
Nolensville, TN
Population 15,074
Brentwood, TN
Population 45,556
Spring Hill, TN
Population 55,765
Smyrna, TN
Population 56,692
La Vergne, TN
Population 40,243
Fairview, TN
Population 10,009
Franklin Demographics And Statistics
Population over time in Franklin
The current population in Franklin is 87,133. The population has increased 45.5% from 2010.
| Year | Population | % Change |
|---|---|---|
| 2024 | 87,133 | 1.8% |
| 2023 | 85,575 | 2.3% |
| 2022 | 83,630 | 2.6% |
| 2021 | 81,531 | 1.1% |
| 2020 | 80,675 | 3.5% |
| 2019 | 77,939 | 3.4% |
| 2018 | 75,366 | 3.3% |
| 2017 | 72,990 | 3.3% |
| 2016 | 70,625 | 3.0% |
| 2015 | 68,549 | 2.9% |
| 2014 | 66,596 | 2.7% |
| 2013 | 64,833 | 2.7% |
| 2012 | 63,117 | 2.6% |
| 2011 | 61,530 | 2.7% |
| 2010 | 59,905 | - |
Race / Ethnicity in Franklin
See the full breakdown
Franklin is:
74.4% White with 64,787 White residents.
5.3% African American with 4,575 African American residents.
0.1% American Indian with 61 American Indian residents.
8.2% Asian with 7,133 Asian residents.
0.0% Hawaiian with 0 Hawaiian residents.
0.5% Other with 430 Other residents.
3.6% Two Or More with 3,095 Two Or More residents.
8.1% Hispanic with 7,052 Hispanic residents.
| Race | Franklin | TN | USA |
|---|---|---|---|
| White | 74.4% | 71.0% | 57.4% |
| African American | 5.3% | 15.4% | 11.9% |
| American Indian | 0.1% | 0.1% | 0.5% |
| Asian | 8.2% | 1.9% | 5.9% |
| Hawaiian | 0.0% | 0.1% | 0.2% |
| Other | 0.5% | 0.4% | 0.6% |
| Two Or More | 3.6% | 3.7% | 4.3% |
| Hispanic | 8.1% | 7.4% | 19.3% |
Gender in Franklin
See the full breakdown
Franklin is 51.2% female with 44,601 female residents.
Franklin is 48.8% male with 42,532 male residents.
| Gender | Franklin | TN | USA |
|---|---|---|---|
| Female | 51.2% | 50.9% | 50.5% |
| Male | 48.8% | 49.1% | 49.5% |
Highest level of educational attainment in Franklin for adults over 25
See the full breakdown
1.0% of adults in Franklin completed < 9th grade.
2.0% of adults in Franklin completed 9-12th grade.
12.0% of adults in Franklin completed high school / ged.
14.0% of adults in Franklin completed some college.
6.0% of adults in Franklin completed associate's degree.
40.0% of adults in Franklin completed bachelor's degree.
19.0% of adults in Franklin completed master's degree.
4.0% of adults in Franklin completed professional degree.
2.0% of adults in Franklin completed doctorate degree.
| Education | Franklin | TN | USA |
|---|---|---|---|
| < 9th Grade | 1.0% | 4.0% | 4.0% |
| 9-12th Grade | 2.0% | 6.0% | 6.0% |
| High School / GED | 12.0% | 31.0% | 26.0% |
| Some College | 14.0% | 20.0% | 19.0% |
| Associate's Degree | 6.0% | 8.0% | 9.0% |
| Bachelor's Degree | 40.0% | 19.0% | 22.0% |
| Master's Degree | 19.0% | 8.0% | 10.0% |
| Professional Degree | 4.0% | 2.0% | 2.0% |
| Doctorate Degree | 2.0% | 2.0% | 2.0% |
Household Income For Franklin, Tennessee
See the full breakdown
2.0% of households in Franklin earn Less than $10,000.
1.3% of households in Franklin earn $10,000 to $14,999.
2.9% of households in Franklin earn $15,000 to $24,999.
4.0% of households in Franklin earn $25,000 to $34,999.
7.7% of households in Franklin earn $35,000 to $49,999.
12.9% of households in Franklin earn $50,000 to $74,999.
10.8% of households in Franklin earn $75,000 to $99,999.
21.1% of households in Franklin earn $100,000 to $149,999.
12.6% of households in Franklin earn $150,000 to $199,999.
24.7% of households in Franklin earn $200,000 or more.
| Income | Franklin | TN | USA |
|---|---|---|---|
| Less than $10,000 | 2.0% | 5.2% | 5.0% |
| $10,000 to $14,999 | 1.3% | 4.0% | 3.4% |
| $15,000 to $24,999 | 2.9% | 7.4% | 6.3% |
| $25,000 to $34,999 | 4.0% | 7.4% | 6.6% |
| $35,000 to $49,999 | 7.7% | 12.0% | 10.1% |
| $50,000 to $74,999 | 12.9% | 17.3% | 15.5% |
| $75,000 to $99,999 | 10.8% | 13.2% | 12.6% |
| $100,000 to $149,999 | 21.1% | 16.8% | 17.5% |
| $150,000 to $199,999 | 12.6% | 7.7% | 9.6% |
| $200,000 or more | 24.7% | 9.0% | 13.4% |
Source: U.S. Census ACS 5-year estimates (2024)


