Compare Knoxville to…
Knoxville SnackAbility
Overall SnackAbility
Crime in Knoxville summary. We use data from the FBI to determine the crime rates in Knoxville. Key points include:
There were 6,939 total crimes in Knoxville in the last reporting year.
The overall crime rate per 100,000 people in Knoxville is 3,461.6 / 100k people.
The violent crime rate per 100,000 people in Knoxville is 740.3 / 100k people.
The property crime rate per 100,000 people in Knoxville is 2,721.3 / 100k people.
Overall, crime in Knoxville is 63.34% above the national average.
Total Crimes
Above National Average
Crime In Knoxville Comparison Table
| Statistic | Count Raw |
Knoxville / 100k People |
Tennessee / 100k People |
National / 100k People |
|---|---|---|---|---|
| Total Crimes Per 100K | 6,939 | 3,461.6 | 2,624.4 | 2,119.2 |
| Violent Crime | 1,484 | 740.3 | 592.3 | 359.0 |
| Murder | 22 | 11.0 | 7.9 | 5.0 |
| Robbery | 164 | 81.8 | 58.4 | 61.0 |
| Aggravated Assault | 1,168 | 582.7 | 488.6 | 256.0 |
| Property Crime | 5,455 | 2,721.3 | 2,032.1 | 1,760.0 |
| Burglary | 659 | 328.7 | 251.8 | 229.0 |
| Larceny | 4,037 | 2,013.9 | 1,443.6 | 1,272.0 |
| Car Theft | 759 | 378.6 | 336.7 | 259.0 |
Source: FBI Uniform Crime Reporting (2024)
Cost of living in Knoxville summary. We use data on the cost of living to determine how expensive it is to live in Knoxville. Real estate prices drive most of the variance in cost of living around Tennessee. Key points include:
The cost of living in Knoxville is 91 with 100 being average.
The cost of living in Knoxville is 0.9x lower than the national average.
The median home value in Knoxville is $369,216.
The median income in Knoxville is $54,039.
Knoxville's Overall Cost Of Living
Lower Than The National Average
Cost Of Living In Knoxville Comparison Table
| Living Expense | Knoxville | Tennessee | National Average |
|---|---|---|---|
| Overall | 91 | 94 | 100 |
| Services | 93 | 99 | 100 |
| Groceries | 98 | 96 | 100 |
| Health | 81 | 82 | 100 |
| Housing | 94 | 95 | 100 |
| Transportation | 96 | 99 | 100 |
| Utilities | 96 | 98 | 100 |
Source: Cost of living index, normalized to US average = 100
Knoxville, TN Weather
The average high in Knoxville is 68.9° and the average low is 47.5°.
There are 88.0 days of precipitation each year.
Expect an average of 49.4 inches of precipitation each year with 5.8 inches of snow.
| Stat | Knoxville |
|---|---|
| Average Annual High | 68.9 |
| Average Annual Low | 47.5 |
| Annual Precipitation Days | 88.0 |
| Average Annual Precipitation | 49.4 |
| Average Annual Snowfall | 5.8 |
Average High
Days of Rain
Source: NOAA climate normals (30-year)
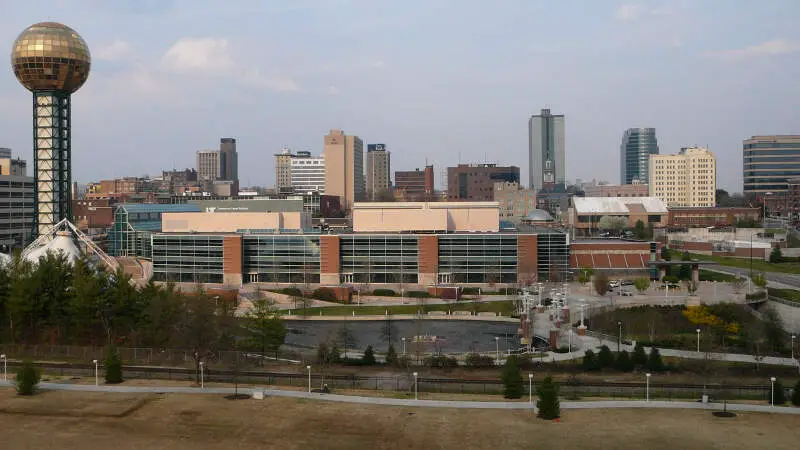
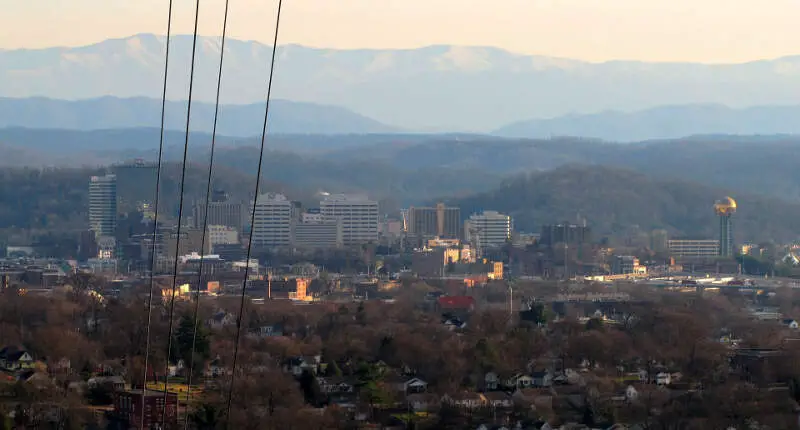
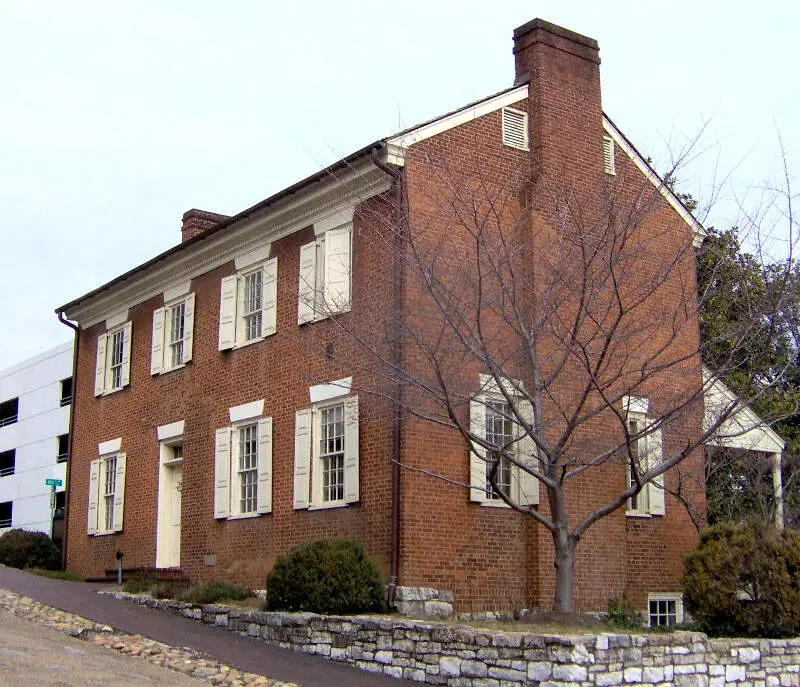
Knoxville, TN Photos


6 Reviews & Comments About Knoxville

I'm from TN, here's what you need to know.
Best town imo is Knoxville. It's pretty nice, and crime isn't too bad. The university is there, and there's usually quite a lot to do. Plus you're close to the mountains.
I was born and raised in Chattanooga. Crime can be bad, especially gang violence. The city is still a little segregated, and there's some racial tension. It's a b***h to commute in. There's constant traffic, and the roads s**k. It does have its upsides though. Downtown/river walk and north chatt are pretty neat. Lots of outdoorsy stuff nearby.
Nashville is Nashville. You got lots of rich people. Obviously very government heavy. It's probably the city with the most to do.
Memphis, well you should probably avoid if possible. Only go for Elvis and then gtfo. Memphis is crazy.
Everything in between is pretty rural. There are some smaller, charming little towns. People usually keep to themselves, and try and go about their business. But there's lots and lots of m**h.
I'm from Knoxville and not gonna lie, we've had shootings, wrecks, m**h labs in the back of Wal-Marts, and s****y weather, but at least we're not as bad as BAMA or FLORIDA, s**k it!
I live in Knoxville. You forgot to put this shithole on the list of worst places. The homeless junkie population mix in with retarded drunk students should have been enough to get knoxvegas on the list.
I live in Tennessee Knoxville to be exact and i love it
I'm from Knoxville and can't wait till I get back to Memphis.
This is the most wonderful place on Earth. It is near the Smoky Mountains, has lots of lakes, and is the home of the University of Tennessee. It's easy to get around, the people are friendly, the food is good, and everything is wonderful.
Go to a University of Tennessee football game. Visit a Calhoun's restaurant. Enjoy yourself!
Rankings & Articles For Knoxville


Locations Around Knoxville
Map Of Knoxville, TN
Best Places Around Knoxville
Farragut, TN
Population 24,634
Seymour, TN
Population 16,216
Oak Ridge, TN
Population 32,693
Clinton, TN
Population 10,239
Alcoa, TN
Population 12,222
Maryville, TN
Population 32,392
Knoxville Demographics And Statistics
Population over time in Knoxville
The current population in Knoxville is 195,185. The population has increased 9.5% from 2010.
| Year | Population | % Change |
|---|---|---|
| 2024 | 195,185 | 0.8% |
| 2023 | 193,721 | 1.0% |
| 2022 | 191,857 | 1.3% |
| 2021 | 189,339 | 1.0% |
| 2020 | 187,487 | 0.7% |
| 2019 | 186,173 | 0.4% |
| 2018 | 185,429 | 0.5% |
| 2017 | 184,465 | 0.3% |
| 2016 | 183,927 | 0.5% |
| 2015 | 183,066 | 0.7% |
| 2014 | 181,759 | 0.5% |
| 2013 | 180,830 | 0.5% |
| 2012 | 179,973 | 0.5% |
| 2011 | 179,085 | 0.5% |
| 2010 | 178,202 | - |
Race / Ethnicity in Knoxville
See the full breakdown
Knoxville is:
70.5% White with 137,641 White residents.
15.6% African American with 30,545 African American residents.
0.1% American Indian with 114 American Indian residents.
1.6% Asian with 3,088 Asian residents.
0.0% Hawaiian with 51 Hawaiian residents.
0.3% Other with 524 Other residents.
4.2% Two Or More with 8,259 Two Or More residents.
7.7% Hispanic with 14,963 Hispanic residents.
| Race | Knoxville | TN | USA |
|---|---|---|---|
| White | 70.5% | 71.0% | 57.4% |
| African American | 15.6% | 15.4% | 11.9% |
| American Indian | 0.1% | 0.1% | 0.5% |
| Asian | 1.6% | 1.9% | 5.9% |
| Hawaiian | 0.0% | 0.1% | 0.2% |
| Other | 0.3% | 0.4% | 0.6% |
| Two Or More | 4.2% | 3.7% | 4.3% |
| Hispanic | 7.7% | 7.4% | 19.3% |
Gender in Knoxville
See the full breakdown
Knoxville is 51.7% female with 100,853 female residents.
Knoxville is 48.3% male with 94,332 male residents.
| Gender | Knoxville | TN | USA |
|---|---|---|---|
| Female | 51.7% | 50.9% | 50.5% |
| Male | 48.3% | 49.1% | 49.5% |
Highest level of educational attainment in Knoxville for adults over 25
See the full breakdown
3.0% of adults in Knoxville completed < 9th grade.
7.0% of adults in Knoxville completed 9-12th grade.
27.0% of adults in Knoxville completed high school / ged.
20.0% of adults in Knoxville completed some college.
9.0% of adults in Knoxville completed associate's degree.
21.0% of adults in Knoxville completed bachelor's degree.
9.0% of adults in Knoxville completed master's degree.
2.0% of adults in Knoxville completed professional degree.
2.0% of adults in Knoxville completed doctorate degree.
| Education | Knoxville | TN | USA |
|---|---|---|---|
| < 9th Grade | 3.0% | 4.0% | 4.0% |
| 9-12th Grade | 7.0% | 6.0% | 6.0% |
| High School / GED | 27.0% | 31.0% | 26.0% |
| Some College | 20.0% | 20.0% | 19.0% |
| Associate's Degree | 9.0% | 8.0% | 9.0% |
| Bachelor's Degree | 21.0% | 19.0% | 22.0% |
| Master's Degree | 9.0% | 8.0% | 10.0% |
| Professional Degree | 2.0% | 2.0% | 2.0% |
| Doctorate Degree | 2.0% | 2.0% | 2.0% |
Household Income For Knoxville, Tennessee
See the full breakdown
7.3% of households in Knoxville earn Less than $10,000.
5.4% of households in Knoxville earn $10,000 to $14,999.
9.3% of households in Knoxville earn $15,000 to $24,999.
10.3% of households in Knoxville earn $25,000 to $34,999.
14.7% of households in Knoxville earn $35,000 to $49,999.
17.4% of households in Knoxville earn $50,000 to $74,999.
11.4% of households in Knoxville earn $75,000 to $99,999.
14.0% of households in Knoxville earn $100,000 to $149,999.
4.4% of households in Knoxville earn $150,000 to $199,999.
5.6% of households in Knoxville earn $200,000 or more.
| Income | Knoxville | TN | USA |
|---|---|---|---|
| Less than $10,000 | 7.3% | 5.2% | 5.0% |
| $10,000 to $14,999 | 5.4% | 4.0% | 3.4% |
| $15,000 to $24,999 | 9.3% | 7.4% | 6.3% |
| $25,000 to $34,999 | 10.3% | 7.4% | 6.6% |
| $35,000 to $49,999 | 14.7% | 12.0% | 10.1% |
| $50,000 to $74,999 | 17.4% | 17.3% | 15.5% |
| $75,000 to $99,999 | 11.4% | 13.2% | 12.6% |
| $100,000 to $149,999 | 14.0% | 16.8% | 17.5% |
| $150,000 to $199,999 | 4.4% | 7.7% | 9.6% |
| $200,000 or more | 5.6% | 9.0% | 13.4% |
Source: U.S. Census ACS 5-year estimates (2024)


