Morristown SnackAbility
Overall SnackAbility
Crime in Morristown summary. We use data from the FBI to determine the crime rates in Morristown. Key points include:
There were 1,057 total crimes in Morristown in the last reporting year.
The overall crime rate per 100,000 people in Morristown is 3,236.4 / 100k people.
The violent crime rate per 100,000 people in Morristown is 765.5 / 100k people.
The property crime rate per 100,000 people in Morristown is 2,470.9 / 100k people.
Overall, crime in Morristown is 52.71% above the national average.
Total Crimes
Above National Average
Crime In Morristown Comparison Table
| Statistic | Count Raw |
Morristown / 100k People |
Tennessee / 100k People |
National / 100k People |
|---|---|---|---|---|
| Total Crimes Per 100K | 1,057 | 3,236.4 | 2,624.4 | 2,119.2 |
| Violent Crime | 250 | 765.5 | 592.3 | 359.0 |
| Murder | 1 | 3.1 | 7.9 | 5.0 |
| Robbery | 11 | 33.7 | 58.4 | 61.0 |
| Aggravated Assault | 223 | 682.8 | 488.6 | 256.0 |
| Property Crime | 807 | 2,470.9 | 2,032.1 | 1,760.0 |
| Burglary | 82 | 251.1 | 251.8 | 229.0 |
| Larceny | 638 | 1,953.5 | 1,443.6 | 1,272.0 |
| Car Theft | 87 | 266.4 | 336.7 | 259.0 |
Source: FBI Uniform Crime Reporting (2024)
Cost of living in Morristown summary. We use data on the cost of living to determine how expensive it is to live in Morristown. Real estate prices drive most of the variance in cost of living around Tennessee. Key points include:
The cost of living in Morristown is 91 with 100 being average.
The cost of living in Morristown is 0.9x lower than the national average.
The median home value in Morristown is $266,072.
The median income in Morristown is $47,917.
Morristown's Overall Cost Of Living
Lower Than The National Average
Cost Of Living In Morristown Comparison Table
| Living Expense | Morristown | Tennessee | National Average |
|---|---|---|---|
| Overall | 91 | 94 | 100 |
| Services | 99 | 99 | 100 |
| Groceries | 97 | 96 | 100 |
| Health | 67 | 82 | 100 |
| Housing | 102 | 95 | 100 |
| Transportation | 99 | 99 | 100 |
| Utilities | 96 | 98 | 100 |
Source: Cost of living index, normalized to US average = 100
Morristown, TN Weather
The average high in Morristown is 68.3° and the average low is 46.6°.
There are 84.5 days of precipitation each year.
Expect an average of 44.9 inches of precipitation each year with 10.9 inches of snow.
| Stat | Morristown |
|---|---|
| Average Annual High | 68.3 |
| Average Annual Low | 46.6 |
| Annual Precipitation Days | 84.5 |
| Average Annual Precipitation | 44.9 |
| Average Annual Snowfall | 10.9 |
Average High
Days of Rain
Source: NOAA climate normals (30-year)
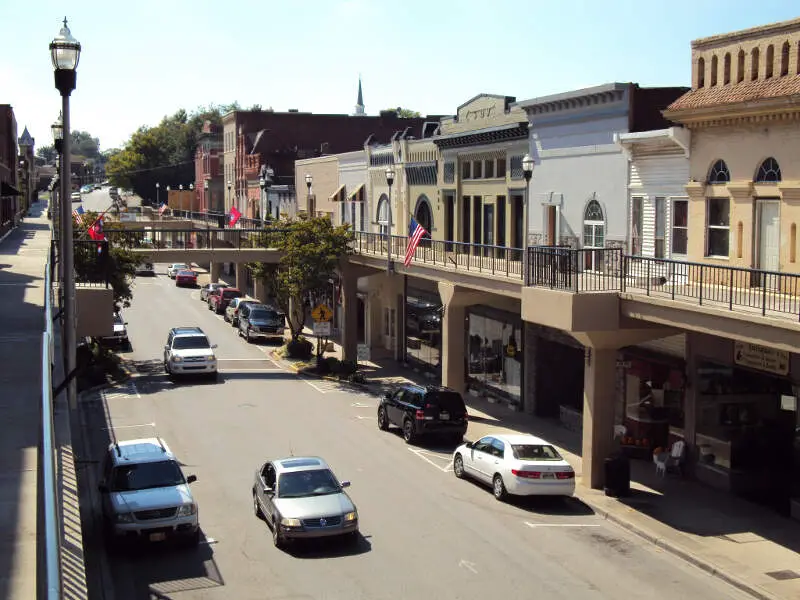
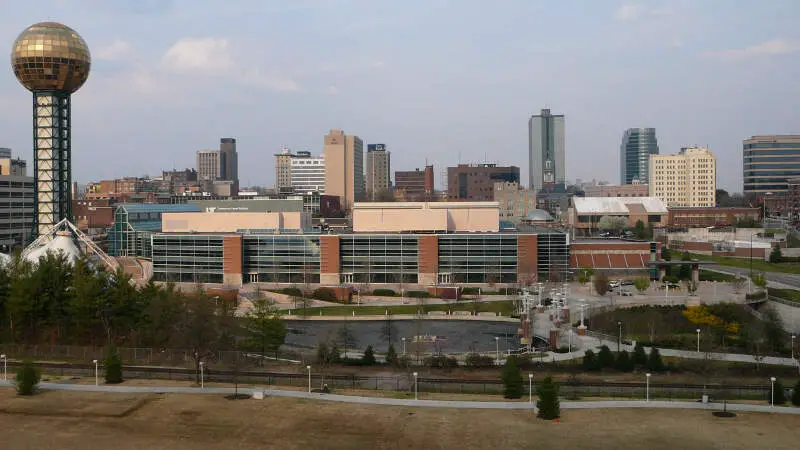
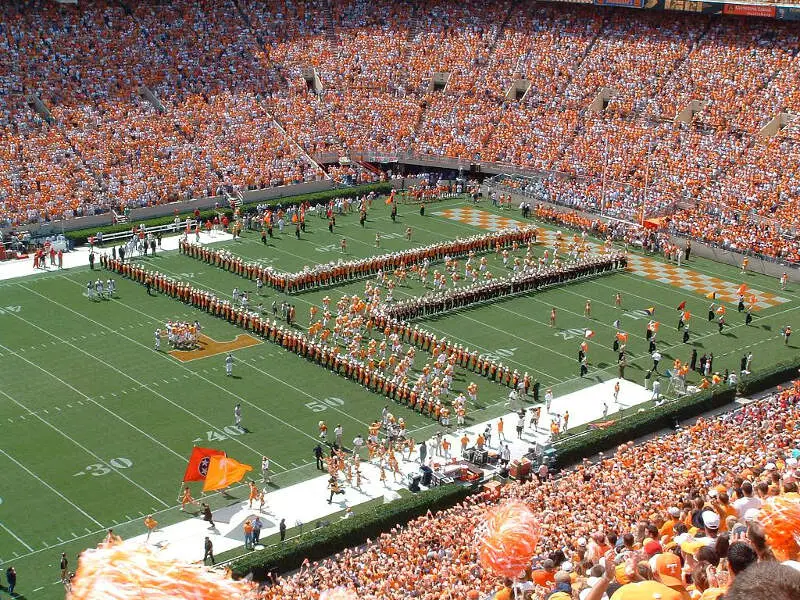
Morristown, TN Photos

1 Reviews & Comments About Morristown

While I do not live here, I do work for the city as a police officer. I can attest to the fact that crime is much more significant than some who live here realize. Gangs are more prevalent in this city than most residents are aware of. Shootings, stabbings, & robberies are actually a common occurrence. People assume that a city that isn't exactly comparable in size to cities like Knoxville or Chattanooga is inherently quiet & innocent. This is not the case. Hispanics make up nearly a quarter of the population. Additionally, over half of the students in the Hamblen County School System are Hispanic. Drug activity is such a powerful force that it's very difficult to combat. We joke that if you don't find m**h at some point during a shift then you were ignoring it. There are genuinely good people here & I will admit that my view of the city is skewed since those are not the type of people I typically deal with on a daily basis. However, I cannot say that I would recommend anyone to move here. There are much better options elsewhere.
The area does have some picturesque quality to it & being in such close proximity to Great Smoky Mountains National Park does make it somewhat more attractive, I suppose. It has plenty of parks but with the amount of homeless people & drug users that frequent them, it makes it difficult to enjoy them. Morristown is growing rapidly & I do hope that with this growth, comes a higher quality of life.
Rankings & Articles For Morristown


Locations Around Morristown
Map Of Morristown, TN
Best Places Around Morristown
Lincoln Park, NJ
Population 10,957
Martinsville, NJ
Population 11,559
Succasunna, NJ
Population 9,799
Florham Park, NJ
Population 13,564
White Meadow Lake, NJ
Population 8,842
Bradley Gardens, NJ
Population 14,165
Westfield, NJ
Population 31,111
Boonton, NJ
Population 8,854
Green Knoll, NJ
Population 6,789
Wharton, NJ
Population 7,318
Morristown Demographics And Statistics
Population over time in Morristown
The current population in Morristown is 31,527. The population has increased 9.7% from 2010.
| Year | Population | % Change |
|---|---|---|
| 2024 | 31,527 | 1.8% |
| 2023 | 30,983 | 1.3% |
| 2022 | 30,574 | 0.6% |
| 2021 | 30,387 | 1.7% |
| 2020 | 29,887 | 0.4% |
| 2019 | 29,782 | 0.8% |
| 2018 | 29,547 | 0.3% |
| 2017 | 29,446 | 0.2% |
| 2016 | 29,395 | 0.5% |
| 2015 | 29,247 | 0.3% |
| 2014 | 29,152 | 0.2% |
| 2013 | 29,107 | -0.0% |
| 2012 | 29,112 | 0.4% |
| 2011 | 28,994 | 0.9% |
| 2010 | 28,749 | - |
Race / Ethnicity in Morristown
See the full breakdown
Morristown is:
65.2% White with 20,556 White residents.
4.7% African American with 1,485 African American residents.
0.1% American Indian with 28 American Indian residents.
0.7% Asian with 233 Asian residents.
1.2% Hawaiian with 376 Hawaiian residents.
0.5% Other with 155 Other residents.
3.6% Two Or More with 1,142 Two Or More residents.
24.0% Hispanic with 7,552 Hispanic residents.
| Race | Morristown | TN | USA |
|---|---|---|---|
| White | 65.2% | 71.0% | 57.4% |
| African American | 4.7% | 15.4% | 11.9% |
| American Indian | 0.1% | 0.1% | 0.5% |
| Asian | 0.7% | 1.9% | 5.9% |
| Hawaiian | 1.2% | 0.1% | 0.2% |
| Other | 0.5% | 0.4% | 0.6% |
| Two Or More | 3.6% | 3.7% | 4.3% |
| Hispanic | 24.0% | 7.4% | 19.3% |
Gender in Morristown
See the full breakdown
Morristown is 51.2% female with 16,138 female residents.
Morristown is 48.8% male with 15,388 male residents.
| Gender | Morristown | TN | USA |
|---|---|---|---|
| Female | 51.2% | 50.9% | 50.5% |
| Male | 48.8% | 49.1% | 49.5% |
Highest level of educational attainment in Morristown for adults over 25
See the full breakdown
7.0% of adults in Morristown completed < 9th grade.
8.0% of adults in Morristown completed 9-12th grade.
41.0% of adults in Morristown completed high school / ged.
21.0% of adults in Morristown completed some college.
9.0% of adults in Morristown completed associate's degree.
8.0% of adults in Morristown completed bachelor's degree.
4.0% of adults in Morristown completed master's degree.
1.0% of adults in Morristown completed professional degree.
1.0% of adults in Morristown completed doctorate degree.
| Education | Morristown | TN | USA |
|---|---|---|---|
| < 9th Grade | 7.0% | 4.0% | 4.0% |
| 9-12th Grade | 8.0% | 6.0% | 6.0% |
| High School / GED | 41.0% | 31.0% | 26.0% |
| Some College | 21.0% | 20.0% | 19.0% |
| Associate's Degree | 9.0% | 8.0% | 9.0% |
| Bachelor's Degree | 8.0% | 19.0% | 22.0% |
| Master's Degree | 4.0% | 8.0% | 10.0% |
| Professional Degree | 1.0% | 2.0% | 2.0% |
| Doctorate Degree | 1.0% | 2.0% | 2.0% |
Household Income For Morristown, Tennessee
See the full breakdown
11.9% of households in Morristown earn Less than $10,000.
5.4% of households in Morristown earn $10,000 to $14,999.
10.8% of households in Morristown earn $15,000 to $24,999.
8.7% of households in Morristown earn $25,000 to $34,999.
15.0% of households in Morristown earn $35,000 to $49,999.
16.6% of households in Morristown earn $50,000 to $74,999.
12.6% of households in Morristown earn $75,000 to $99,999.
11.7% of households in Morristown earn $100,000 to $149,999.
3.4% of households in Morristown earn $150,000 to $199,999.
3.8% of households in Morristown earn $200,000 or more.
| Income | Morristown | TN | USA |
|---|---|---|---|
| Less than $10,000 | 11.9% | 5.2% | 5.0% |
| $10,000 to $14,999 | 5.4% | 4.0% | 3.4% |
| $15,000 to $24,999 | 10.8% | 7.4% | 6.3% |
| $25,000 to $34,999 | 8.7% | 7.4% | 6.6% |
| $35,000 to $49,999 | 15.0% | 12.0% | 10.1% |
| $50,000 to $74,999 | 16.6% | 17.3% | 15.5% |
| $75,000 to $99,999 | 12.6% | 13.2% | 12.6% |
| $100,000 to $149,999 | 11.7% | 16.8% | 17.5% |
| $150,000 to $199,999 | 3.4% | 7.7% | 9.6% |
| $200,000 or more | 3.8% | 9.0% | 13.4% |
Source: U.S. Census ACS 5-year estimates (2024)


