Mount Juliet, TN
Demographics And Statistics
Living In Mount Juliet, Tennessee Summary
Life in Mount Juliet research summary. HomeSnacks has been using Saturday Night Science to research the quality of life in Mount Juliet over the past nine years using Census, FBI, Zillow, and other primary data sources. Based on the most recently available data, we found the following about life in Mount Juliet:
The population in Mount Juliet is 40,828.
The median home value in Mount Juliet is $557,137.
The median income in Mount Juliet is $107,847.
The cost of living in Mount Juliet is 114 which is 1.1x higher than the national average.
The median rent in Mount Juliet is $1,875.
The unemployment rate in Mount Juliet is 3.5%.
The poverty rate in Mount Juliet is 4.1%.
The average high in Mount Juliet is 69.6° and the average low is 46.8°.
Mount Juliet SnackAbility
Overall SnackAbility
Mount Juliet, TN Crime Report
Crime in Mount Juliet summary. We use data from the FBI to determine the crime rates in Mount Juliet. Key points include:
There were 495 total crimes in Mount Juliet in the last reporting year.
The overall crime rate per 100,000 people in Mount Juliet is 1,123.7 / 100k people.
The violent crime rate per 100,000 people in Mount Juliet is 158.9 / 100k people.
The property crime rate per 100,000 people in Mount Juliet is 964.8 / 100k people.
Overall, crime in Mount Juliet is -46.97% below the national average.
Total Crimes
Below National Average
Crime In Mount Juliet Comparison Table
| Statistic | Count Raw |
Mount Juliet / 100k People |
Tennessee / 100k People |
National / 100k People |
|---|---|---|---|---|
| Total Crimes Per 100K | 495 | 1,123.7 | 2,624.4 | 2,119.2 |
| Violent Crime | 70 | 158.9 | 592.3 | 359.0 |
| Murder | 0 | 0.0 | 7.9 | 5.0 |
| Robbery | 1 | 2.3 | 58.4 | 61.0 |
| Aggravated Assault | 64 | 145.3 | 488.6 | 256.0 |
| Property Crime | 425 | 964.8 | 2,032.1 | 1,760.0 |
| Burglary | 14 | 31.8 | 251.8 | 229.0 |
| Larceny | 384 | 871.8 | 1,443.6 | 1,272.0 |
| Car Theft | 27 | 61.3 | 336.7 | 259.0 |
Mount Juliet, TN Cost Of Living
Cost of living in Mount Juliet summary. We use data on the cost of living to determine how expensive it is to live in Mount Juliet. Real estate prices drive most of the variance in cost of living around Tennessee. Key points include:
The cost of living in Mount Juliet is 114 with 100 being average.
The cost of living in Mount Juliet is 1.1x higher than the national average.
The median home value in Mount Juliet is $557,137.
The median income in Mount Juliet is $107,847.
Mount Juliet's Overall Cost Of Living
Higher Than The National Average
Cost Of Living In Mount Juliet Comparison Table
| Living Expense | Mount Juliet | Tennessee | National Average | |
|---|---|---|---|---|
| Overall | 114 | 90 | 100 | |
| Services | 95 | 93 | 100 | |
| Groceries | 102 | 99 | 100 | |
| Health | 92 | 87 | 100 | |
| Housing | 161 | 81 | 100 | |
| Transportation | 90 | 89 | 100 | |
| Utilities | 104 | 95 | 100 | |
Mount Juliet, TN Weather
The average high in Mount Juliet is 69.6° and the average low is 46.8°.
There are 81.7 days of precipitation each year.
Expect an average of 51.0 inches of precipitation each year with 3.3 inches of snow.
| Stat | Mount Juliet |
|---|---|
| Average Annual High | 69.6 |
| Average Annual Low | 46.8 |
| Annual Precipitation Days | 81.7 |
| Average Annual Precipitation | 51.0 |
| Average Annual Snowfall | 3.3 |
Average High
Days of Rain
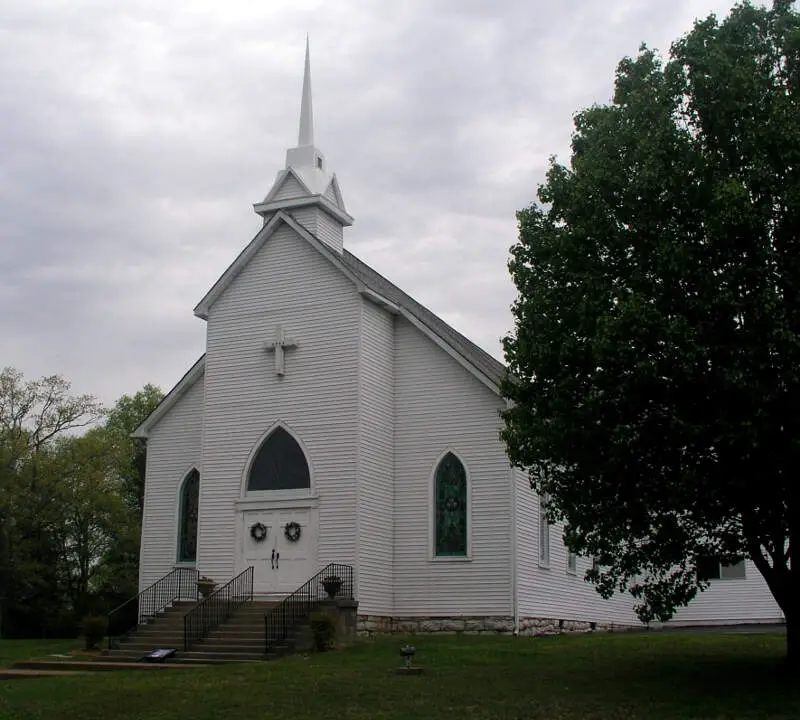
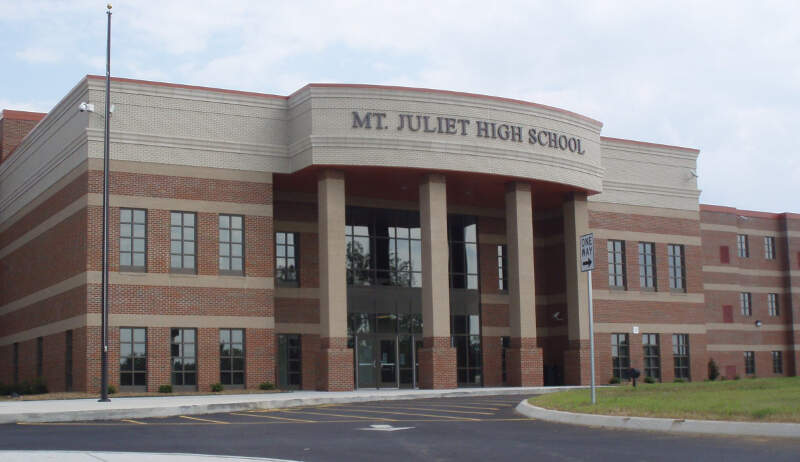
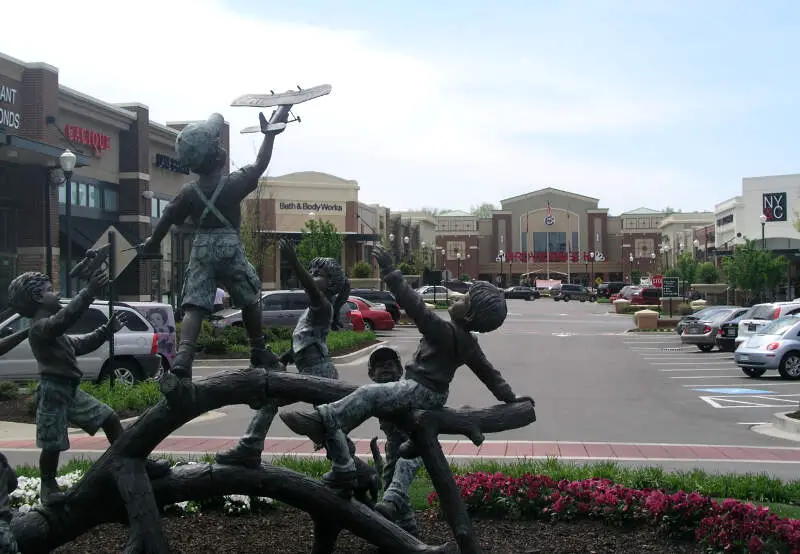
Mount Juliet, TN Photos


Rankings for Mount Juliet in Tennessee


Locations Around Mount Juliet
Map Of Mount Juliet, TN
Best Places Around Mount Juliet
Nolensville, TN
Population 14,545
Green Hill, TN
Population 6,617
Hendersonville, TN
Population 62,390
Smyrna, TN
Population 55,066
Millersville, TN
Population 5,885
Lebanon, TN
Population 41,951
Gallatin, TN
Population 46,667
Goodlettsville, TN
Population 17,598
La Vergne, TN
Population 38,944
Mount Juliet Demographics And Statistics
Population over time in Mount Juliet
The current population in Mount Juliet is 40,828. The population has increased 86.2% from 2010.
| Year | Population | % Change |
|---|---|---|
| 2023 | 40,828 | 3.3% |
| 2022 | 39,525 | 3.9% |
| 2021 | 38,059 | 6.2% |
| 2020 | 35,834 | 4.2% |
| 2019 | 34,377 | 4.5% |
| 2018 | 32,882 | 4.7% |
| 2017 | 31,397 | 5.2% |
| 2016 | 29,853 | 5.1% |
| 2015 | 28,395 | 5.0% |
| 2014 | 27,053 | 5.0% |
| 2013 | 25,775 | 5.0% |
| 2012 | 24,557 | 7.7% |
| 2011 | 22,804 | 4.0% |
| 2010 | 21,922 | - |
Race / Ethnicity in Mount Juliet
Mount Juliet is:
75.8% White with 30,957 White residents.
7.7% African American with 3,139 African American residents.
0.0% American Indian with 20 American Indian residents.
4.8% Asian with 1,957 Asian residents.
0.0% Hawaiian with 0 Hawaiian residents.
1.8% Other with 724 Other residents.
2.5% Two Or More with 1,006 Two Or More residents.
7.4% Hispanic with 3,025 Hispanic residents.
| Race | Mount Juliet | TN | USA |
|---|---|---|---|
| White | 75.8% | 71.5% | 58.2% |
| African American | 7.7% | 15.7% | 12.0% |
| American Indian | 0.0% | 0.1% | 0.5% |
| Asian | 4.8% | 1.8% | 5.7% |
| Hawaiian | 0.0% | 0.1% | 0.2% |
| Other | 1.8% | 0.4% | 0.5% |
| Two Or More | 2.5% | 3.3% | 3.9% |
| Hispanic | 7.4% | 7.1% | 19.0% |
Gender in Mount Juliet
Mount Juliet is 50.5% female with 20,612 female residents.
Mount Juliet is 49.5% male with 20,216 male residents.
| Gender | Mount Juliet | TN | USA |
|---|---|---|---|
| Female | 50.5% | 50.9% | 50.5% |
| Male | 49.5% | 49.1% | 49.5% |
Highest level of educational attainment in Mount Juliet for adults over 25
2.0% of adults in Mount Juliet completed < 9th grade.
2.0% of adults in Mount Juliet completed 9-12th grade.
19.0% of adults in Mount Juliet completed high school / ged.
20.0% of adults in Mount Juliet completed some college.
8.0% of adults in Mount Juliet completed associate's degree.
33.0% of adults in Mount Juliet completed bachelor's degree.
13.0% of adults in Mount Juliet completed master's degree.
1.0% of adults in Mount Juliet completed professional degree.
2.0% of adults in Mount Juliet completed doctorate degree.
| Education | Mount Juliet | TN | USA |
|---|---|---|---|
| < 9th Grade | 2.0% | 4.0% | 5.0% |
| 9-12th Grade | 2.0% | 7.0% | 6.0% |
| High School / GED | 19.0% | 31.0% | 26.0% |
| Some College | 20.0% | 20.0% | 19.0% |
| Associate's Degree | 8.0% | 8.0% | 9.0% |
| Bachelor's Degree | 33.0% | 19.0% | 21.0% |
| Master's Degree | 13.0% | 8.0% | 10.0% |
| Professional Degree | 1.0% | 2.0% | 2.0% |
| Doctorate Degree | 2.0% | 1.0% | 2.0% |
Household Income For Mount Juliet, Tennessee
2.7% of households in Mount Juliet earn Less than $10,000.
0.2% of households in Mount Juliet earn $10,000 to $14,999.
2.0% of households in Mount Juliet earn $15,000 to $24,999.
5.9% of households in Mount Juliet earn $25,000 to $34,999.
5.1% of households in Mount Juliet earn $35,000 to $49,999.
14.5% of households in Mount Juliet earn $50,000 to $74,999.
14.8% of households in Mount Juliet earn $75,000 to $99,999.
25.9% of households in Mount Juliet earn $100,000 to $149,999.
14.7% of households in Mount Juliet earn $150,000 to $199,999.
14.3% of households in Mount Juliet earn $200,000 or more.
| Income | Mount Juliet | TN | USA |
|---|---|---|---|
| Less than $10,000 | 2.7% | 5.2% | 4.9% |
| $10,000 to $14,999 | 0.2% | 4.2% | 3.6% |
| $15,000 to $24,999 | 2.0% | 7.8% | 6.6% |
| $25,000 to $34,999 | 5.9% | 7.9% | 6.8% |
| $35,000 to $49,999 | 5.1% | 12.4% | 10.4% |
| $50,000 to $74,999 | 14.5% | 17.4% | 15.7% |
| $75,000 to $99,999 | 14.8% | 13.2% | 12.7% |
| $100,000 to $149,999 | 25.9% | 16.4% | 17.4% |
| $150,000 to $199,999 | 14.7% | 7.1% | 9.3% |
| $200,000 or more | 14.3% | 8.3% | 12.6% |


