Azle SnackAbility
Overall SnackAbility
Crime in Azle summary. We use data from the FBI to determine the crime rates in Azle. Key points include:
There were 281 total crimes in Azle in the last reporting year.
The overall crime rate per 100,000 people in Azle is 1,878.2 / 100k people.
The violent crime rate per 100,000 people in Azle is 233.9 / 100k people.
The property crime rate per 100,000 people in Azle is 1,644.3 / 100k people.
Overall, crime in Azle is -11.37% below the national average.
Total Crimes
Below National Average
Crime In Azle Comparison Table
| Statistic | Count Raw |
Azle / 100k People |
Texas / 100k People |
National / 100k People |
|---|---|---|---|---|
| Total Crimes Per 100K | 281 | 1,878.2 | 2,429.9 | 2,119.2 |
| Violent Crime | 35 | 233.9 | 389.4 | 359.0 |
| Murder | 1 | 6.7 | 5.2 | 5.0 |
| Robbery | 3 | 20.1 | 63.5 | 61.0 |
| Aggravated Assault | 23 | 153.7 | 270.7 | 256.0 |
| Property Crime | 246 | 1,644.3 | 2,040.5 | 1,760.0 |
| Burglary | 33 | 220.6 | 284.3 | 229.0 |
| Larceny | 191 | 1,276.7 | 1,425.6 | 1,272.0 |
| Car Theft | 22 | 147.0 | 330.7 | 259.0 |
Source: FBI Uniform Crime Reporting (2024)
Cost of living in Azle summary. We use data on the cost of living to determine how expensive it is to live in Azle. Real estate prices drive most of the variance in cost of living around Texas. Key points include:
The cost of living in Azle is 100 with 100 being average.
The cost of living in Azle is 1.0x lower than the national average.
The median home value in Azle is $330,263.
The median income in Azle is $68,514.
Azle's Overall Cost Of Living
Lower Than The National Average
Cost Of Living In Azle Comparison Table
| Living Expense | Azle | Texas | National Average |
|---|---|---|---|
| Overall | 100 | 93 | 100 |
| Services | 105 | 100 | 100 |
| Groceries | 104 | 99 | 100 |
| Health | 105 | 81 | 100 |
| Housing | 99 | 97 | 100 |
| Transportation | 109 | 103 | 100 |
| Utilities | 98 | 100 | 100 |
Source: Cost of living index, normalized to US average = 100
Azle, TX Weather
The average high in Azle is 76.9° and the average low is 54.4°.
There are 54.6 days of precipitation each year.
Expect an average of 36.0 inches of precipitation each year with 1.9 inches of snow.
| Stat | Azle |
|---|---|
| Average Annual High | 76.9 |
| Average Annual Low | 54.4 |
| Annual Precipitation Days | 54.6 |
| Average Annual Precipitation | 36.0 |
| Average Annual Snowfall | 1.9 |
Average High
Days of Rain
Source: NOAA climate normals (30-year)
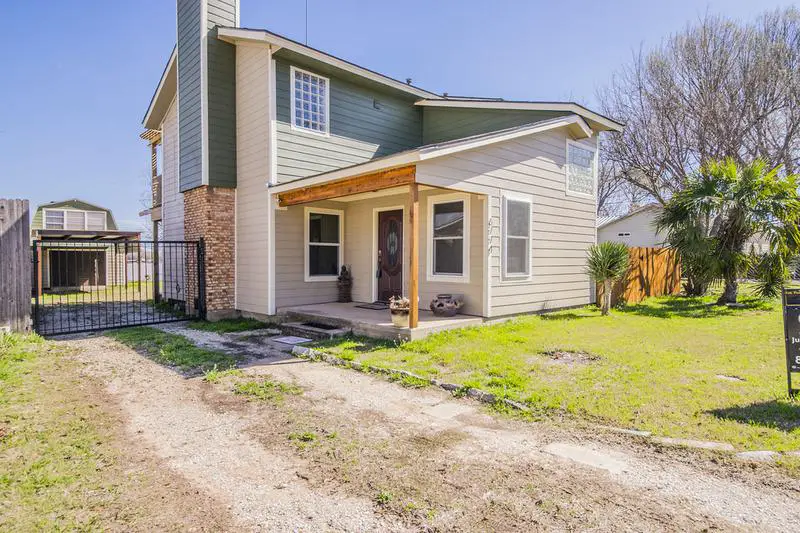
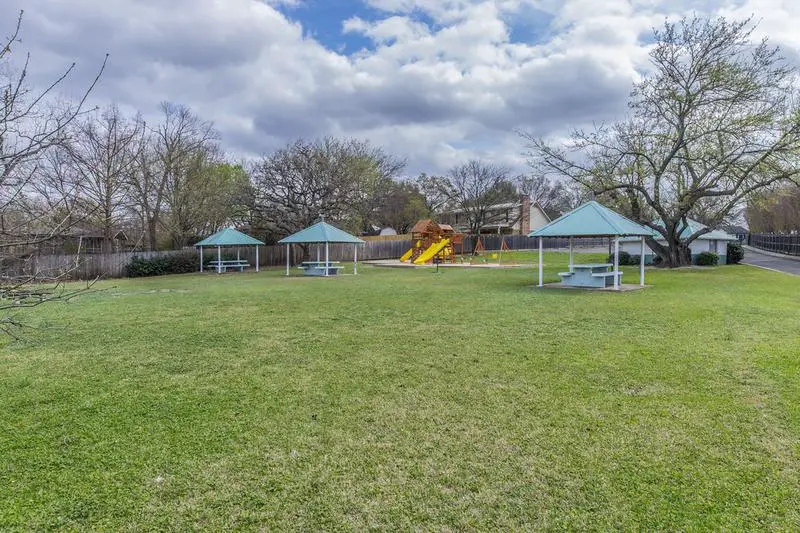
Azle, TX Photos

Rankings & Articles For Azle


Locations Around Azle
Map Of Azle, TX
Best Places Around Azle
Keller, TX
Population 45,976
Watauga, TX
Population 23,233
Saginaw, TX
Population 24,970
North Richland Hills, TX
Population 70,780
White Settlement, TX
Population 18,150
Weatherford, TX
Population 35,788
Benbrook, TX
Population 24,557
Fort Worth, TX
Population 963,194
Lakeside, VA
Population 12,654
Azle Demographics And Statistics
Population over time in Azle
The current population in Azle is 14,126. The population has increased 31.2% from 2010.
| Year | Population | % Change |
|---|---|---|
| 2024 | 14,126 | 2.9% |
| 2023 | 13,734 | 2.4% |
| 2022 | 13,409 | 1.9% |
| 2021 | 13,157 | 1.6% |
| 2020 | 12,950 | 1.2% |
| 2019 | 12,796 | 5.3% |
| 2018 | 12,149 | 4.7% |
| 2017 | 11,607 | 5.0% |
| 2016 | 11,054 | 1.8% |
| 2015 | 10,860 | 1.1% |
| 2014 | 10,744 | -0.1% |
| 2013 | 10,752 | -0.3% |
| 2012 | 10,788 | 0.1% |
| 2011 | 10,782 | 0.1% |
| 2010 | 10,769 | - |
Race / Ethnicity in Azle
See the full breakdown
Azle is:
75.9% White with 10,717 White residents.
1.6% African American with 221 African American residents.
0.6% American Indian with 82 American Indian residents.
0.9% Asian with 122 Asian residents.
0.0% Hawaiian with 0 Hawaiian residents.
1.4% Other with 196 Other residents.
3.4% Two Or More with 478 Two Or More residents.
16.4% Hispanic with 2,310 Hispanic residents.
| Race | Azle | TX | USA |
|---|---|---|---|
| White | 75.9% | 39.1% | 57.4% |
| African American | 1.6% | 11.9% | 11.9% |
| American Indian | 0.6% | 0.1% | 0.5% |
| Asian | 0.9% | 5.5% | 5.9% |
| Hawaiian | 0.0% | 0.1% | 0.2% |
| Other | 1.4% | 0.4% | 0.6% |
| Two Or More | 3.4% | 3.1% | 4.3% |
| Hispanic | 16.4% | 39.7% | 19.3% |
Gender in Azle
See the full breakdown
Azle is 48.1% female with 6,791 female residents.
Azle is 51.9% male with 7,334 male residents.
| Gender | Azle | TX | USA |
|---|---|---|---|
| Female | 48.1% | 50.1% | 50.5% |
| Male | 51.9% | 49.9% | 49.5% |
Highest level of educational attainment in Azle for adults over 25
See the full breakdown
3.0% of adults in Azle completed < 9th grade.
6.0% of adults in Azle completed 9-12th grade.
36.0% of adults in Azle completed high school / ged.
23.0% of adults in Azle completed some college.
10.0% of adults in Azle completed associate's degree.
16.0% of adults in Azle completed bachelor's degree.
5.0% of adults in Azle completed master's degree.
1.0% of adults in Azle completed professional degree.
0.0% of adults in Azle completed doctorate degree.
| Education | Azle | TX | USA |
|---|---|---|---|
| < 9th Grade | 3.0% | 8.0% | 4.0% |
| 9-12th Grade | 6.0% | 7.0% | 6.0% |
| High School / GED | 36.0% | 24.0% | 26.0% |
| Some College | 23.0% | 20.0% | 19.0% |
| Associate's Degree | 10.0% | 8.0% | 9.0% |
| Bachelor's Degree | 16.0% | 21.0% | 22.0% |
| Master's Degree | 5.0% | 9.0% | 10.0% |
| Professional Degree | 1.0% | 2.0% | 2.0% |
| Doctorate Degree | 0.0% | 1.0% | 2.0% |
Household Income For Azle, Texas
See the full breakdown
4.3% of households in Azle earn Less than $10,000.
2.8% of households in Azle earn $10,000 to $14,999.
8.5% of households in Azle earn $15,000 to $24,999.
5.1% of households in Azle earn $25,000 to $34,999.
14.8% of households in Azle earn $35,000 to $49,999.
19.9% of households in Azle earn $50,000 to $74,999.
12.4% of households in Azle earn $75,000 to $99,999.
17.9% of households in Azle earn $100,000 to $149,999.
6.0% of households in Azle earn $150,000 to $199,999.
8.2% of households in Azle earn $200,000 or more.
| Income | Azle | TX | USA |
|---|---|---|---|
| Less than $10,000 | 4.3% | 5.0% | 5.0% |
| $10,000 to $14,999 | 2.8% | 3.3% | 3.4% |
| $15,000 to $24,999 | 8.5% | 6.3% | 6.3% |
| $25,000 to $34,999 | 5.1% | 6.8% | 6.6% |
| $35,000 to $49,999 | 14.8% | 10.5% | 10.1% |
| $50,000 to $74,999 | 19.9% | 16.1% | 15.5% |
| $75,000 to $99,999 | 12.4% | 12.8% | 12.6% |
| $100,000 to $149,999 | 17.9% | 17.3% | 17.5% |
| $150,000 to $199,999 | 6.0% | 9.5% | 9.6% |
| $200,000 or more | 8.2% | 12.5% | 13.4% |
Source: U.S. Census ACS 5-year estimates (2024)


