Compare Fort Worth to…
Fort Worth SnackAbility
Overall SnackAbility
Crime in Fort Worth summary. We use data from the FBI to determine the crime rates in Fort Worth. Key points include:
There were 31,502 total crimes in Fort Worth in the last reporting year.
The overall crime rate per 100,000 people in Fort Worth is 3,158.2 / 100k people.
The violent crime rate per 100,000 people in Fort Worth is 458.4 / 100k people.
The property crime rate per 100,000 people in Fort Worth is 2,699.8 / 100k people.
Overall, crime in Fort Worth is 49.02% above the national average.
Total Crimes
Above National Average
Crime In Fort Worth Comparison Table
| Statistic | Count Raw |
Fort Worth / 100k People |
Texas / 100k People |
National / 100k People |
|---|---|---|---|---|
| Total Crimes Per 100K | 31,502 | 3,158.2 | 2,429.9 | 2,119.2 |
| Violent Crime | 4,572 | 458.4 | 389.4 | 359.0 |
| Murder | 74 | 7.4 | 5.2 | 5.0 |
| Robbery | 724 | 72.6 | 63.5 | 61.0 |
| Aggravated Assault | 3,223 | 323.1 | 270.7 | 256.0 |
| Property Crime | 26,930 | 2,699.8 | 2,040.5 | 1,760.0 |
| Burglary | 3,437 | 344.6 | 284.3 | 229.0 |
| Larceny | 18,372 | 1,841.8 | 1,425.6 | 1,272.0 |
| Car Theft | 5,121 | 513.4 | 330.7 | 259.0 |
Source: FBI Uniform Crime Reporting (2024)
Cost of living in Fort Worth summary. We use data on the cost of living to determine how expensive it is to live in Fort Worth. Real estate prices drive most of the variance in cost of living around Texas. Key points include:
The cost of living in Fort Worth is 104 with 100 being average.
The cost of living in Fort Worth is 1.0x higher than the national average.
The median home value in Fort Worth is $298,050.
The median income in Fort Worth is $79,507.
Fort Worth's Overall Cost Of Living
Higher Than The National Average
Cost Of Living In Fort Worth Comparison Table
| Living Expense | Fort Worth | Texas | National Average |
|---|---|---|---|
| Overall | 104 | 93 | 100 |
| Services | 101 | 100 | 100 |
| Groceries | 103 | 99 | 100 |
| Health | 105 | 81 | 100 |
| Housing | 100 | 97 | 100 |
| Transportation | 108 | 103 | 100 |
| Utilities | 101 | 100 | 100 |
Source: Cost of living index, normalized to US average = 100
Fort Worth, TX Weather
The average high in Fort Worth is 76.7° and the average low is 55.1°.
There are 52.3 days of precipitation each year.
Expect an average of 36.4 inches of precipitation each year with 1.4 inches of snow.
| Stat | Fort Worth |
|---|---|
| Average Annual High | 76.7 |
| Average Annual Low | 55.1 |
| Annual Precipitation Days | 52.3 |
| Average Annual Precipitation | 36.4 |
| Average Annual Snowfall | 1.4 |
Average High
Days of Rain
Source: NOAA climate normals (30-year)
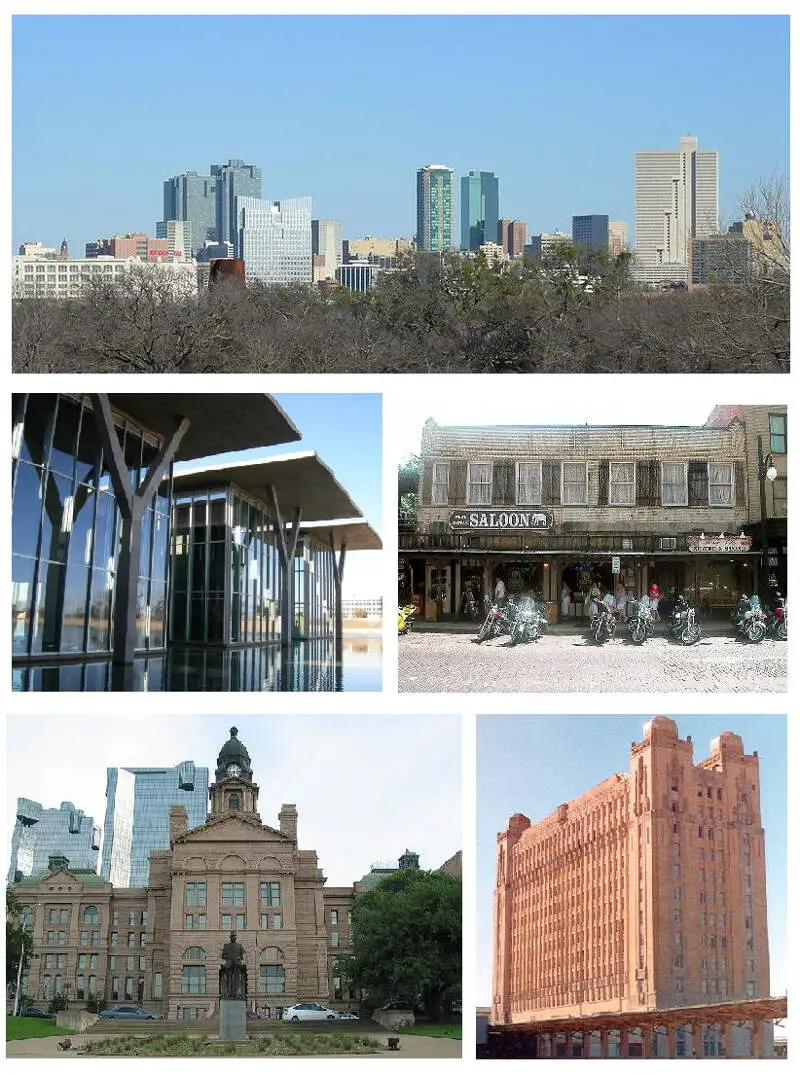
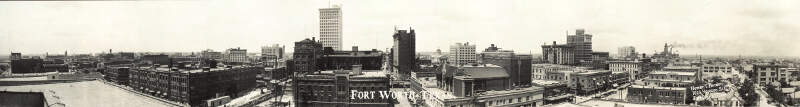
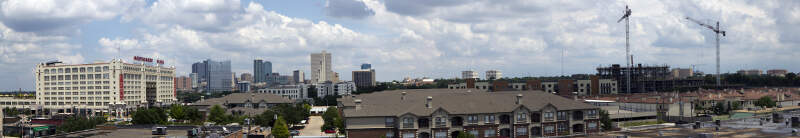
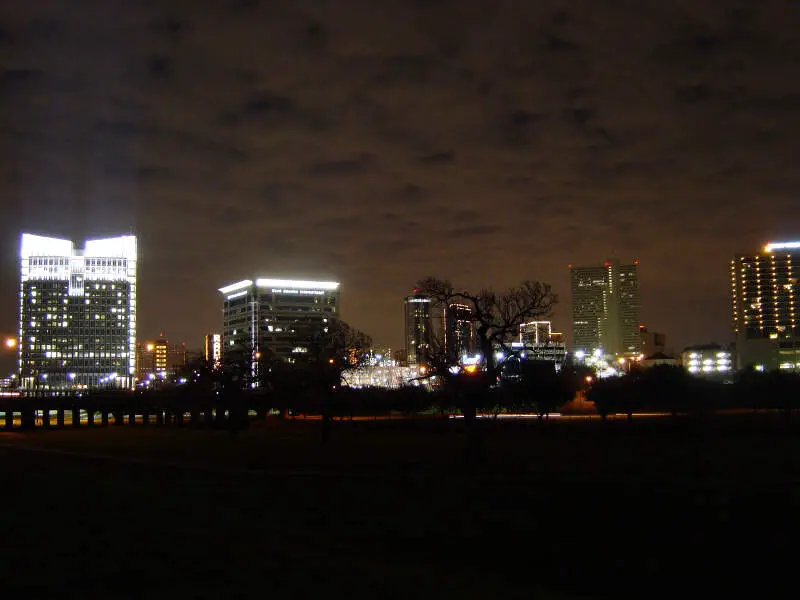
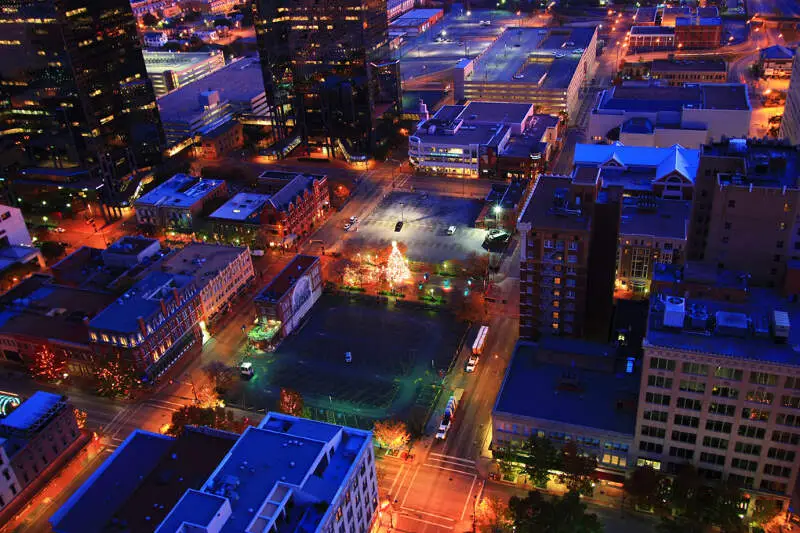
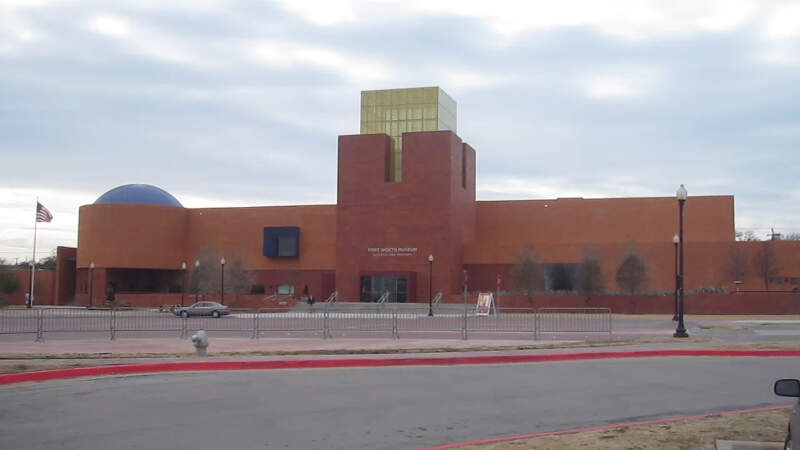
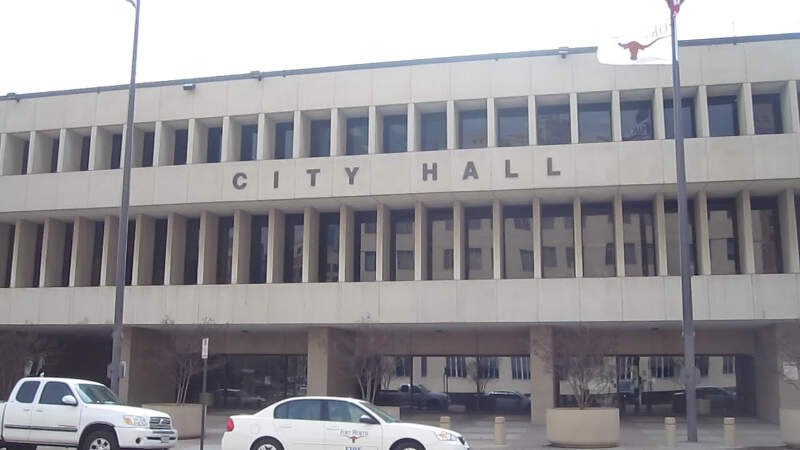
Fort Worth, TX Photos

3 Reviews & Comments About Fort Worth

Low crime. Great schools with great teachers who get paid well. Plenty of things to do whether it's night life or family oriented. Cost of living is great.
Restaurants. Lots of great places to eat. Also a lot of places to shop.
I generally love this city but of course it has it faults just like any city in America. The crime depends on where you live, race, and the time plus place you decide to visit. North side is the Latino part of town and good for authentic food but not a place to be at night if you are on the lighter side. Some of the border towns like Weatherford, Lake Worth, Azle, or White Settlement give a nice small town country feel. There are always things to do a good places to eat, just ask the locals!
On the downside of Fort Worth, the interstate and traffic is horrible but not as bad as Dallas. Pay attention to exits or you might miss yours. You pay change from the I-820 to I-35 be in the far left lane then have to get over 4 lanes to exit in less than 5 minutes! The roads are fast paced and you will be cut off if you are driving too slow. Speeds can go from 60-95 mph within a blink of an eye.
Fort Worth Stockyards are a good place to visit for all ages. At 11am and 4pm you can see the walking of the Longhorns down the center which I feel is enjoyable for all ages even if you are a bunch of 20 somethings looking for a cool local event. It is also the location of Billy Bobs for concerts and a country bar plus there are gift shops and small diners to keep your tummy full.
Crime rate is medium to moderate, depending on the neighborhood depends on how the school rates. North side of Fort Worth the schools are much better as well as West. South and east are very lower class schools. Smaller communities are even better and have many community centers and events.
Lots of small parks that are great to take kids, lots of little snack stands around. Snow Cone city you can basically find a stand on every corner. Quiet
Rankings & Articles For Fort Worth


Locations Around Fort Worth
Map Of Fort Worth, TX
Best Places Around Fort Worth
Keller, TX
Population 45,976
Colleyville, TX
Population 26,012
Southlake, TX
Population 31,137
Bedford, TX
Population 49,085
Watauga, TX
Population 23,233
Grapevine, TX
Population 51,139
Saginaw, TX
Population 24,970
Mansfield, TX
Population 77,510
North Richland Hills, TX
Population 70,780
Hurst, TX
Population 39,861
Fort Worth Demographics And Statistics
Population over time in Fort Worth
The current population in Fort Worth is 963,194. The population has increased 36.6% from 2010.
| Year | Population | % Change |
|---|---|---|
| 2024 | 963,194 | 2.3% |
| 2023 | 941,311 | 1.8% |
| 2022 | 924,663 | 1.8% |
| 2021 | 908,469 | 1.8% |
| 2020 | 892,221 | 2.0% |
| 2019 | 874,401 | 2.2% |
| 2018 | 855,786 | 2.5% |
| 2017 | 835,129 | 2.4% |
| 2016 | 815,930 | 2.4% |
| 2015 | 796,614 | 2.3% |
| 2014 | 778,573 | 2.3% |
| 2013 | 761,092 | 2.3% |
| 2012 | 743,865 | 2.6% |
| 2011 | 724,699 | 2.7% |
| 2010 | 705,349 | - |
Race / Ethnicity in Fort Worth
See the full breakdown
Fort Worth is:
36.5% White with 351,563 White residents.
19.3% African American with 186,317 African American residents.
0.1% American Indian with 1,400 American Indian residents.
5.4% Asian with 51,639 Asian residents.
0.1% Hawaiian with 1,251 Hawaiian residents.
0.5% Other with 5,255 Other residents.
3.4% Two Or More with 32,567 Two Or More residents.
34.6% Hispanic with 333,202 Hispanic residents.
| Race | Fort Worth | TX | USA |
|---|---|---|---|
| White | 36.5% | 39.1% | 57.4% |
| African American | 19.3% | 11.9% | 11.9% |
| American Indian | 0.1% | 0.1% | 0.5% |
| Asian | 5.4% | 5.5% | 5.9% |
| Hawaiian | 0.1% | 0.1% | 0.2% |
| Other | 0.5% | 0.4% | 0.6% |
| Two Or More | 3.4% | 3.1% | 4.3% |
| Hispanic | 34.6% | 39.7% | 19.3% |
Gender in Fort Worth
See the full breakdown
Fort Worth is 51.0% female with 491,325 female residents.
Fort Worth is 49.0% male with 471,868 male residents.
| Gender | Fort Worth | TX | USA |
|---|---|---|---|
| Female | 51.0% | 50.1% | 50.5% |
| Male | 49.0% | 49.9% | 49.5% |
Highest level of educational attainment in Fort Worth for adults over 25
See the full breakdown
6.0% of adults in Fort Worth completed < 9th grade.
8.0% of adults in Fort Worth completed 9-12th grade.
25.0% of adults in Fort Worth completed high school / ged.
20.0% of adults in Fort Worth completed some college.
8.0% of adults in Fort Worth completed associate's degree.
21.0% of adults in Fort Worth completed bachelor's degree.
9.0% of adults in Fort Worth completed master's degree.
2.0% of adults in Fort Worth completed professional degree.
1.0% of adults in Fort Worth completed doctorate degree.
| Education | Fort Worth | TX | USA |
|---|---|---|---|
| < 9th Grade | 6.0% | 8.0% | 4.0% |
| 9-12th Grade | 8.0% | 7.0% | 6.0% |
| High School / GED | 25.0% | 24.0% | 26.0% |
| Some College | 20.0% | 20.0% | 19.0% |
| Associate's Degree | 8.0% | 8.0% | 9.0% |
| Bachelor's Degree | 21.0% | 21.0% | 22.0% |
| Master's Degree | 9.0% | 9.0% | 10.0% |
| Professional Degree | 2.0% | 2.0% | 2.0% |
| Doctorate Degree | 1.0% | 1.0% | 2.0% |
Household Income For Fort Worth, Texas
See the full breakdown
4.6% of households in Fort Worth earn Less than $10,000.
3.1% of households in Fort Worth earn $10,000 to $14,999.
5.4% of households in Fort Worth earn $15,000 to $24,999.
6.5% of households in Fort Worth earn $25,000 to $34,999.
10.6% of households in Fort Worth earn $35,000 to $49,999.
16.6% of households in Fort Worth earn $50,000 to $74,999.
13.7% of households in Fort Worth earn $75,000 to $99,999.
18.4% of households in Fort Worth earn $100,000 to $149,999.
9.9% of households in Fort Worth earn $150,000 to $199,999.
11.1% of households in Fort Worth earn $200,000 or more.
| Income | Fort Worth | TX | USA |
|---|---|---|---|
| Less than $10,000 | 4.6% | 5.0% | 5.0% |
| $10,000 to $14,999 | 3.1% | 3.3% | 3.4% |
| $15,000 to $24,999 | 5.4% | 6.3% | 6.3% |
| $25,000 to $34,999 | 6.5% | 6.8% | 6.6% |
| $35,000 to $49,999 | 10.6% | 10.5% | 10.1% |
| $50,000 to $74,999 | 16.6% | 16.1% | 15.5% |
| $75,000 to $99,999 | 13.7% | 12.8% | 12.6% |
| $100,000 to $149,999 | 18.4% | 17.3% | 17.5% |
| $150,000 to $199,999 | 9.9% | 9.5% | 9.6% |
| $200,000 or more | 11.1% | 12.5% | 13.4% |
Source: U.S. Census ACS 5-year estimates (2024)


