Boerne, TX
Demographics And Statistics
Living In Boerne, Texas Summary
Life in Boerne research summary. HomeSnacks has been using Saturday Night Science to research the quality of life in Boerne over the past nine years using Census, FBI, Zillow, and other primary data sources. Based on the most recently available data, we found the following about life in Boerne:
The population in Boerne is 19,509.
The median home value in Boerne is $554,916.
The median income in Boerne is $86,838.
The cost of living in Boerne is 115 which is 1.1x higher than the national average.
The median rent in Boerne is $1,577.
The unemployment rate in Boerne is 2.7%.
The poverty rate in Boerne is 7.0%.
The average high in Boerne is 77.9° and the average low is 53.9°.
Boerne SnackAbility
Overall SnackAbility
Boerne, TX Crime Report
Crime in Boerne summary. We use data from the FBI to determine the crime rates in Boerne. Key points include:
There were 298 total crimes in Boerne in the last reporting year.
The overall crime rate per 100,000 people in Boerne is 1,286.4 / 100k people.
The violent crime rate per 100,000 people in Boerne is 107.9 / 100k people.
The property crime rate per 100,000 people in Boerne is 1,178.5 / 100k people.
Overall, crime in Boerne is -39.30% below the national average.
Total Crimes
Below National Average
Crime In Boerne Comparison Table
| Statistic | Count Raw |
Boerne / 100k People |
Texas / 100k People |
National / 100k People |
|---|---|---|---|---|
| Total Crimes Per 100K | 298 | 1,286.4 | 2,429.9 | 2,119.2 |
| Violent Crime | 25 | 107.9 | 389.4 | 359.0 |
| Murder | 0 | 0.0 | 5.2 | 5.0 |
| Robbery | 2 | 8.6 | 63.5 | 61.0 |
| Aggravated Assault | 18 | 77.7 | 270.7 | 256.0 |
| Property Crime | 273 | 1,178.5 | 2,040.5 | 1,760.0 |
| Burglary | 74 | 319.4 | 284.3 | 229.0 |
| Larceny | 162 | 699.3 | 1,425.6 | 1,272.0 |
| Car Theft | 37 | 159.7 | 330.7 | 259.0 |
Boerne, TX Cost Of Living
Cost of living in Boerne summary. We use data on the cost of living to determine how expensive it is to live in Boerne. Real estate prices drive most of the variance in cost of living around Texas. Key points include:
The cost of living in Boerne is 115 with 100 being average.
The cost of living in Boerne is 1.1x higher than the national average.
The median home value in Boerne is $554,916.
The median income in Boerne is $86,838.
Boerne's Overall Cost Of Living
Higher Than The National Average
Cost Of Living In Boerne Comparison Table
| Living Expense | Boerne | Texas | National Average | |
|---|---|---|---|---|
| Overall | 115 | 92 | 100 | |
| Services | 99 | 97 | 100 | |
| Groceries | 93 | 97 | 100 | |
| Health | 107 | 93 | 100 | |
| Housing | 157 | 82 | 100 | |
| Transportation | 94 | 94 | 100 | |
| Utilities | 85 | 104 | 100 | |
Boerne, TX Weather
The average high in Boerne is 77.9° and the average low is 53.9°.
There are 52.6 days of precipitation each year.
Expect an average of 36.8 inches of precipitation each year with 0.0 inches of snow.
| Stat | Boerne |
|---|---|
| Average Annual High | 77.9 |
| Average Annual Low | 53.9 |
| Annual Precipitation Days | 52.6 |
| Average Annual Precipitation | 36.8 |
| Average Annual Snowfall | 0.0 |
Average High
Days of Rain
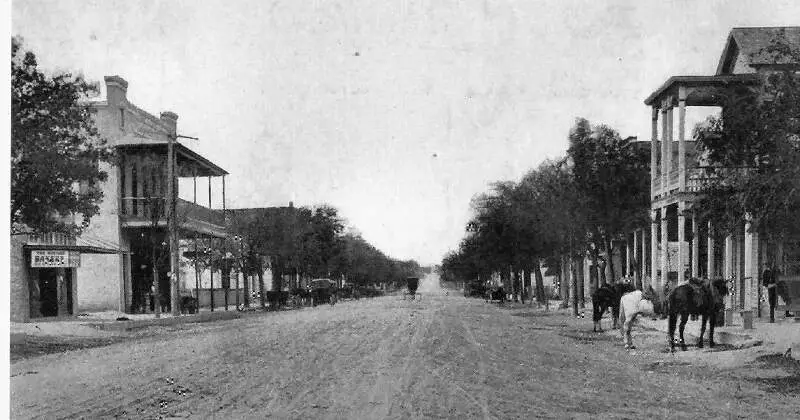
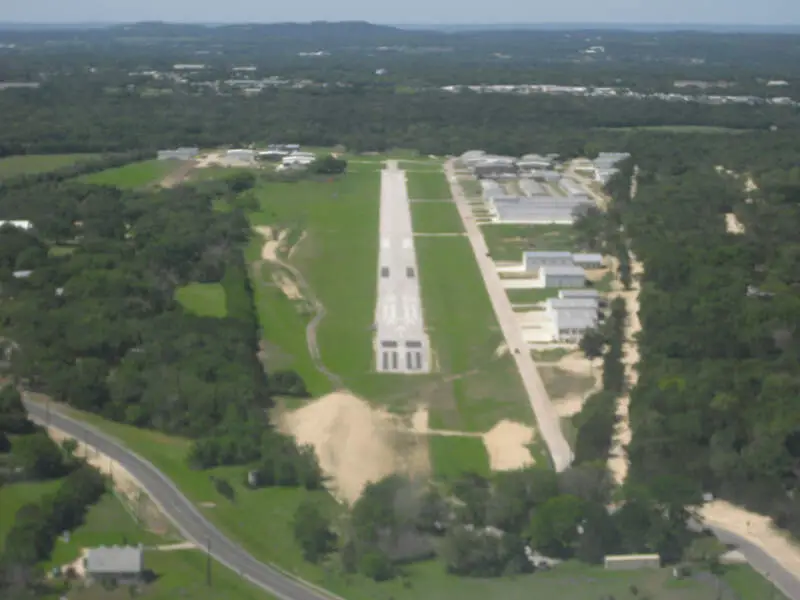
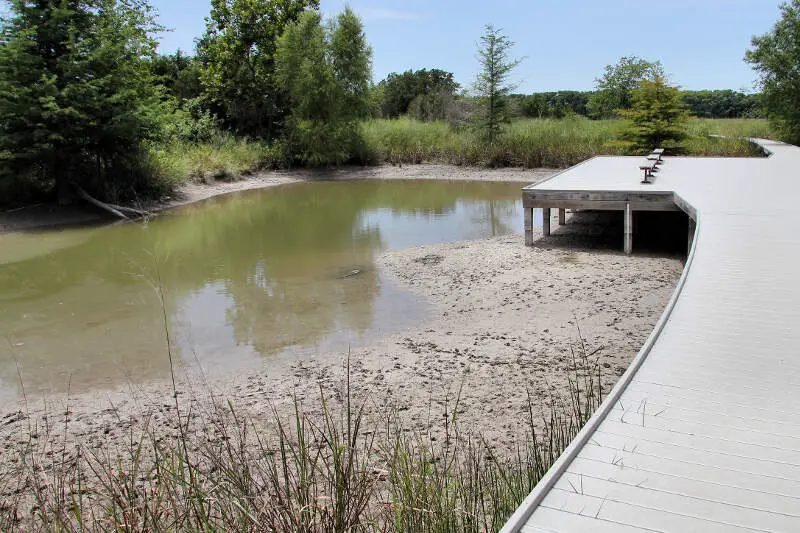
Boerne, TX Photos
1 Reviews & Comments About Boerne
/5

HomeSnacks User - 2018-07-15 23:32:10.348250
Very low crime, highly rated schools. Small town atmosphere with unique downtown area. Very friendly people. Several good restaurants and a lovely walkway that runs along the river and through the back of downtown.
Love Bear Moon Bakery! Enjoy walking along the river, feeding the ducks. Lots of festivals and a lovely townsquare with special events.
Rankings for Boerne in Texas


Locations Around Boerne
Map Of Boerne, TX
Best Places Around Boerne
Fredericksburg, TX
Population 11,254
Cibolo, TX
Population 33,829
Converse, TX
Population 28,764
Timberwood Park, TX
Population 34,980
Leon Valley, TX
Population 11,479
San Marcos, TX
Population 68,920
Kerrville, TX
Population 24,532
Live Oak, TX
Population 15,875
Schertz, TX
Population 43,128
New Braunfels, TX
Population 98,700
Boerne Demographics And Statistics
Population over time in Boerne
The current population in Boerne is 19,509. The population has increased 101.9% from 2010.
| Year | Population | % Change |
|---|---|---|
| 2023 | 19,509 | 5.6% |
| 2022 | 18,475 | 6.9% |
| 2021 | 17,290 | 2.3% |
| 2020 | 16,909 | 6.4% |
| 2019 | 15,891 | 7.4% |
| 2018 | 14,799 | 7.0% |
| 2017 | 13,834 | 5.9% |
| 2016 | 13,066 | 6.5% |
| 2015 | 12,272 | 5.1% |
| 2014 | 11,674 | 4.3% |
| 2013 | 11,197 | 5.5% |
| 2012 | 10,618 | 5.1% |
| 2011 | 10,105 | 4.6% |
| 2010 | 9,664 | - |
Race / Ethnicity in Boerne
Boerne is:
64.5% White with 12,592 White residents.
1.3% African American with 254 African American residents.
0.0% American Indian with 0 American Indian residents.
1.3% Asian with 247 Asian residents.
0.2% Hawaiian with 32 Hawaiian residents.
0.1% Other with 16 Other residents.
3.4% Two Or More with 658 Two Or More residents.
29.3% Hispanic with 5,710 Hispanic residents.
| Race | Boerne | TX | USA |
|---|---|---|---|
| White | 64.5% | 39.9% | 58.2% |
| African American | 1.3% | 11.9% | 12.0% |
| American Indian | 0.0% | 0.2% | 0.5% |
| Asian | 1.3% | 5.3% | 5.7% |
| Hawaiian | 0.2% | 0.1% | 0.2% |
| Other | 0.1% | 0.4% | 0.5% |
| Two Or More | 3.4% | 2.9% | 3.9% |
| Hispanic | 29.3% | 39.5% | 19.0% |
Gender in Boerne
Boerne is 52.3% female with 10,198 female residents.
Boerne is 47.7% male with 9,311 male residents.
| Gender | Boerne | TX | USA |
|---|---|---|---|
| Female | 52.3% | 50.1% | 50.5% |
| Male | 47.7% | 49.9% | 49.5% |
Highest level of educational attainment in Boerne for adults over 25
2.0% of adults in Boerne completed < 9th grade.
6.0% of adults in Boerne completed 9-12th grade.
15.0% of adults in Boerne completed high school / ged.
20.0% of adults in Boerne completed some college.
9.0% of adults in Boerne completed associate's degree.
30.0% of adults in Boerne completed bachelor's degree.
14.0% of adults in Boerne completed master's degree.
2.0% of adults in Boerne completed professional degree.
2.0% of adults in Boerne completed doctorate degree.
| Education | Boerne | TX | USA |
|---|---|---|---|
| < 9th Grade | 2.0% | 7.0% | 5.0% |
| 9-12th Grade | 6.0% | 7.0% | 6.0% |
| High School / GED | 15.0% | 24.0% | 26.0% |
| Some College | 20.0% | 21.0% | 19.0% |
| Associate's Degree | 9.0% | 8.0% | 9.0% |
| Bachelor's Degree | 30.0% | 21.0% | 21.0% |
| Master's Degree | 14.0% | 9.0% | 10.0% |
| Professional Degree | 2.0% | 2.0% | 2.0% |
| Doctorate Degree | 2.0% | 1.0% | 2.0% |
Household Income For Boerne, Texas
5.7% of households in Boerne earn Less than $10,000.
0.3% of households in Boerne earn $10,000 to $14,999.
5.7% of households in Boerne earn $15,000 to $24,999.
5.5% of households in Boerne earn $25,000 to $34,999.
14.7% of households in Boerne earn $35,000 to $49,999.
11.2% of households in Boerne earn $50,000 to $74,999.
13.8% of households in Boerne earn $75,000 to $99,999.
16.0% of households in Boerne earn $100,000 to $149,999.
10.0% of households in Boerne earn $150,000 to $199,999.
17.2% of households in Boerne earn $200,000 or more.
| Income | Boerne | TX | USA |
|---|---|---|---|
| Less than $10,000 | 5.7% | 5.0% | 4.9% |
| $10,000 to $14,999 | 0.3% | 3.4% | 3.6% |
| $15,000 to $24,999 | 5.7% | 6.5% | 6.6% |
| $25,000 to $34,999 | 5.5% | 7.0% | 6.8% |
| $35,000 to $49,999 | 14.7% | 10.9% | 10.4% |
| $50,000 to $74,999 | 11.2% | 16.4% | 15.7% |
| $75,000 to $99,999 | 13.8% | 12.8% | 12.7% |
| $100,000 to $149,999 | 16.0% | 17.2% | 17.4% |
| $150,000 to $199,999 | 10.0% | 9.1% | 9.3% |
| $200,000 or more | 17.2% | 11.7% | 12.6% |


