Compare Corpus Christi to…
Corpus Christi SnackAbility
Overall SnackAbility
Crime in Corpus Christi summary. We use data from the FBI to determine the crime rates in Corpus Christi. Key points include:
There were 12,249 total crimes in Corpus Christi in the last reporting year.
The overall crime rate per 100,000 people in Corpus Christi is 3,874.9 / 100k people.
The violent crime rate per 100,000 people in Corpus Christi is 863.6 / 100k people.
The property crime rate per 100,000 people in Corpus Christi is 3,011.3 / 100k people.
Overall, crime in Corpus Christi is 82.85% above the national average.
Total Crimes
Above National Average
Crime In Corpus Christi Comparison Table
| Statistic | Count Raw |
Corpus Christi / 100k People |
Texas / 100k People |
National / 100k People |
|---|---|---|---|---|
| Total Crimes Per 100K | 12,249 | 3,874.9 | 2,429.9 | 2,119.2 |
| Violent Crime | 2,730 | 863.6 | 389.4 | 359.0 |
| Murder | 27 | 8.5 | 5.2 | 5.0 |
| Robbery | 366 | 115.8 | 63.5 | 61.0 |
| Aggravated Assault | 2,102 | 665.0 | 270.7 | 256.0 |
| Property Crime | 9,519 | 3,011.3 | 2,040.5 | 1,760.0 |
| Burglary | 1,651 | 522.3 | 284.3 | 229.0 |
| Larceny | 6,634 | 2,098.6 | 1,425.6 | 1,272.0 |
| Car Theft | 1,234 | 390.4 | 330.7 | 259.0 |
Source: FBI Uniform Crime Reporting (2024)
Cost of living in Corpus Christi summary. We use data on the cost of living to determine how expensive it is to live in Corpus Christi. Real estate prices drive most of the variance in cost of living around Texas. Key points include:
The cost of living in Corpus Christi is 100 with 100 being average.
The cost of living in Corpus Christi is 1.0x lower than the national average.
The median home value in Corpus Christi is $223,501.
The median income in Corpus Christi is $67,394.
Corpus Christi's Overall Cost Of Living
Lower Than The National Average
Cost Of Living In Corpus Christi Comparison Table
| Living Expense | Corpus Christi | Texas | National Average |
|---|---|---|---|
| Overall | 100 | 93 | 100 |
| Services | 95 | 100 | 100 |
| Groceries | 99 | 99 | 100 |
| Health | 95 | 81 | 100 |
| Housing | 102 | 97 | 100 |
| Transportation | 104 | 103 | 100 |
| Utilities | 100 | 100 | 100 |
Source: Cost of living index, normalized to US average = 100
Corpus Christi, TX Weather
The average high in Corpus Christi is 80.3° and the average low is 64.2°.
There are 42.0 days of precipitation each year.
Expect an average of 31.4 inches of precipitation each year with 0.1 inches of snow.
| Stat | Corpus Christi |
|---|---|
| Average Annual High | 80.3 |
| Average Annual Low | 64.2 |
| Annual Precipitation Days | 42.0 |
| Average Annual Precipitation | 31.4 |
| Average Annual Snowfall | 0.1 |
Average High
Days of Rain
Source: NOAA climate normals (30-year)
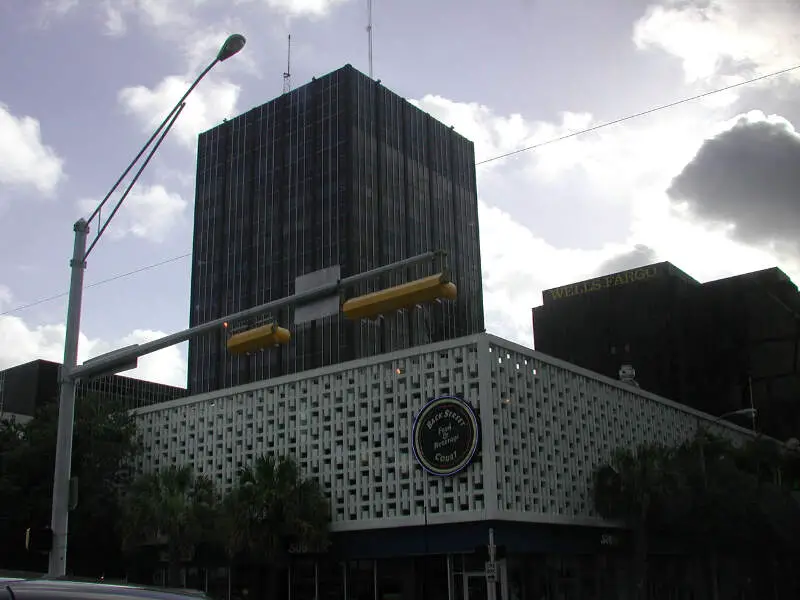
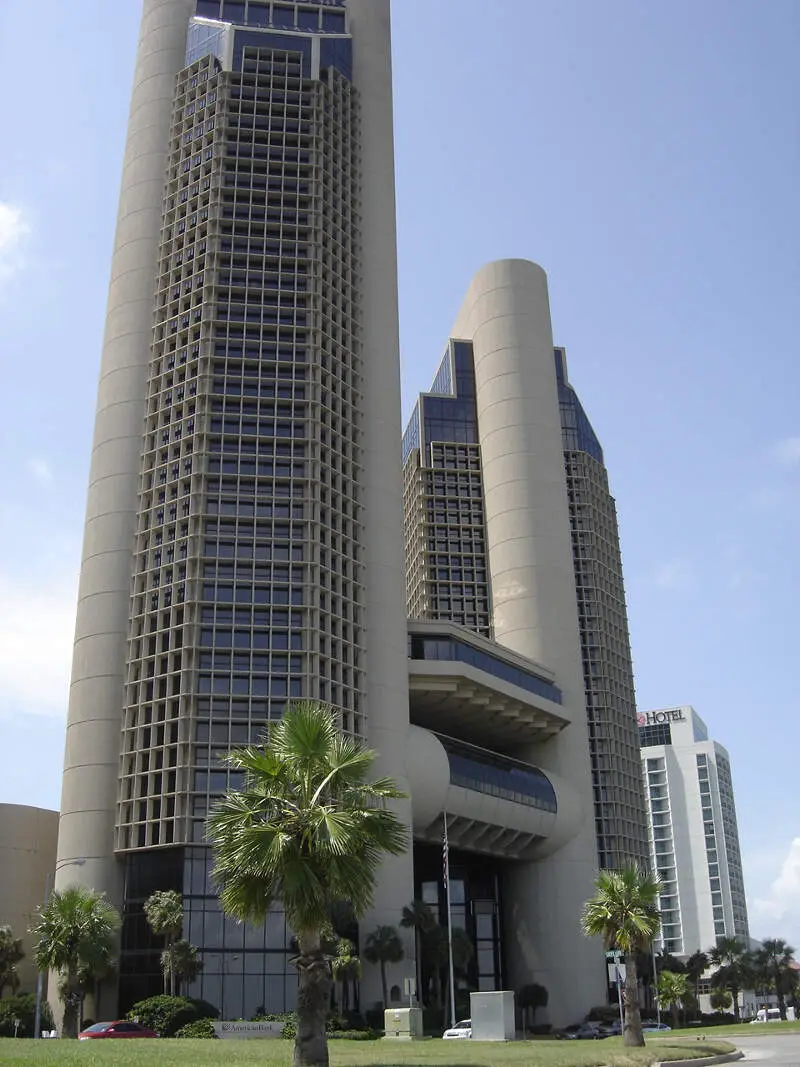
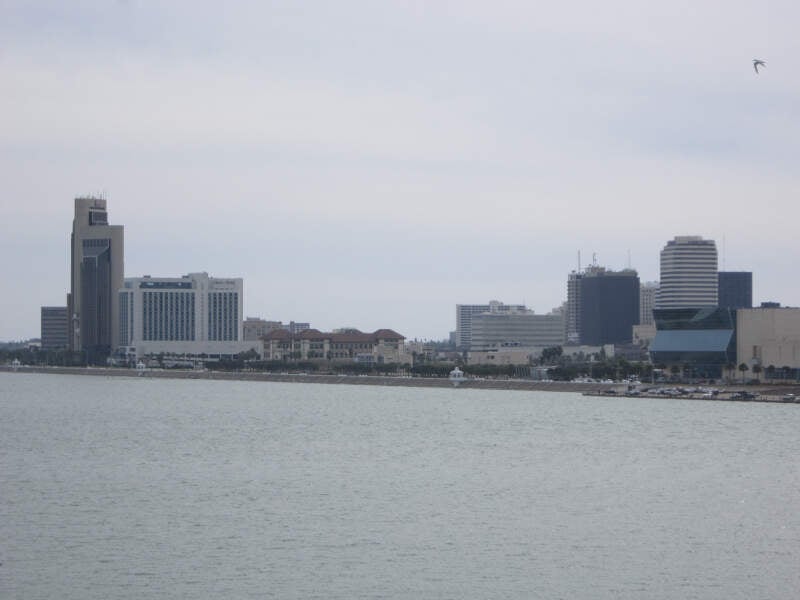
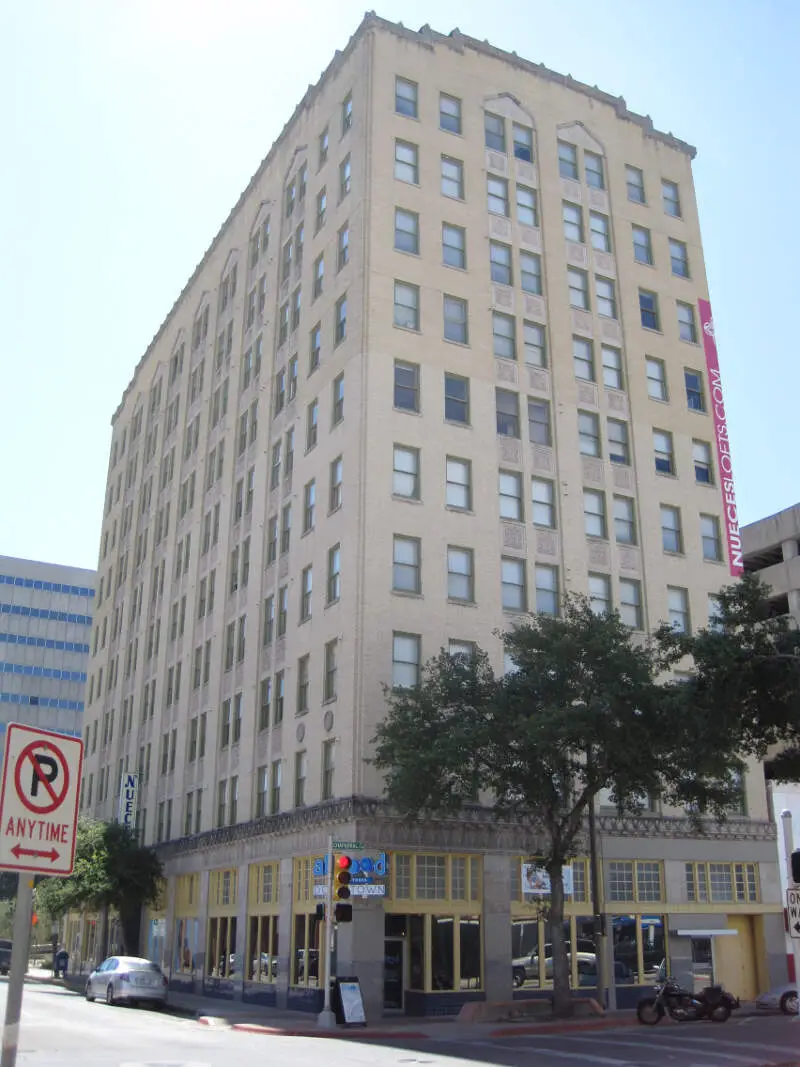
Corpus Christi, TX Photos

1 Reviews & Comments About Corpus Christi

I'm surprised corpus Christi didn't make the list of worst cause its my hometown and i do not recommend anyone to stop in this s***y hot town because you will be Robbed or stabbed for 50cents
Rankings & Articles For Corpus Christi


Locations Around Corpus Christi
Map Of Corpus Christi, TX
Best Places Around Corpus Christi
Portland, TX
Population 20,543
Kingsville, TX
Population 24,994
Lakeside, VA
Population 12,654
Robstown, TX
Population 10,236
Corpus Christi Demographics And Statistics
Population over time in Corpus Christi
The current population in Corpus Christi is 317,419. The population has increased 6.0% from 2010.
| Year | Population | % Change |
|---|---|---|
| 2024 | 317,419 | 0.0% |
| 2023 | 317,383 | -0.1% |
| 2022 | 317,804 | -0.1% |
| 2021 | 318,168 | -2.5% |
| 2020 | 326,332 | 0.2% |
| 2019 | 325,780 | 0.3% |
| 2018 | 324,692 | 0.6% |
| 2017 | 322,726 | 0.8% |
| 2016 | 320,050 | 1.1% |
| 2015 | 316,513 | 1.2% |
| 2014 | 312,680 | 1.2% |
| 2013 | 308,993 | 1.2% |
| 2012 | 305,427 | 1.1% |
| 2011 | 302,113 | 0.9% |
| 2010 | 299,324 | - |
Race / Ethnicity in Corpus Christi
See the full breakdown
Corpus Christi is:
29.2% White with 92,670 White residents.
3.8% African American with 12,162 African American residents.
0.1% American Indian with 449 American Indian residents.
2.5% Asian with 7,794 Asian residents.
0.1% Hawaiian with 163 Hawaiian residents.
0.3% Other with 1,046 Other residents.
2.0% Two Or More with 6,193 Two Or More residents.
62.0% Hispanic with 196,942 Hispanic residents.
| Race | Corpus Christi | TX | USA |
|---|---|---|---|
| White | 29.2% | 39.1% | 57.4% |
| African American | 3.8% | 11.9% | 11.9% |
| American Indian | 0.1% | 0.1% | 0.5% |
| Asian | 2.5% | 5.5% | 5.9% |
| Hawaiian | 0.1% | 0.1% | 0.2% |
| Other | 0.3% | 0.4% | 0.6% |
| Two Or More | 2.0% | 3.1% | 4.3% |
| Hispanic | 62.0% | 39.7% | 19.3% |
Gender in Corpus Christi
See the full breakdown
Corpus Christi is 50.1% female with 159,032 female residents.
Corpus Christi is 49.9% male with 158,387 male residents.
| Gender | Corpus Christi | TX | USA |
|---|---|---|---|
| Female | 50.1% | 50.1% | 50.5% |
| Male | 49.9% | 49.9% | 49.5% |
Highest level of educational attainment in Corpus Christi for adults over 25
See the full breakdown
7.0% of adults in Corpus Christi completed < 9th grade.
8.0% of adults in Corpus Christi completed 9-12th grade.
28.0% of adults in Corpus Christi completed high school / ged.
24.0% of adults in Corpus Christi completed some college.
9.0% of adults in Corpus Christi completed associate's degree.
16.0% of adults in Corpus Christi completed bachelor's degree.
6.0% of adults in Corpus Christi completed master's degree.
1.0% of adults in Corpus Christi completed professional degree.
1.0% of adults in Corpus Christi completed doctorate degree.
| Education | Corpus Christi | TX | USA |
|---|---|---|---|
| < 9th Grade | 7.0% | 8.0% | 4.0% |
| 9-12th Grade | 8.0% | 7.0% | 6.0% |
| High School / GED | 28.0% | 24.0% | 26.0% |
| Some College | 24.0% | 20.0% | 19.0% |
| Associate's Degree | 9.0% | 8.0% | 9.0% |
| Bachelor's Degree | 16.0% | 21.0% | 22.0% |
| Master's Degree | 6.0% | 9.0% | 10.0% |
| Professional Degree | 1.0% | 2.0% | 2.0% |
| Doctorate Degree | 1.0% | 1.0% | 2.0% |
Household Income For Corpus Christi, Texas
See the full breakdown
5.5% of households in Corpus Christi earn Less than $10,000.
4.6% of households in Corpus Christi earn $10,000 to $14,999.
7.6% of households in Corpus Christi earn $15,000 to $24,999.
7.4% of households in Corpus Christi earn $25,000 to $34,999.
11.3% of households in Corpus Christi earn $35,000 to $49,999.
19.0% of households in Corpus Christi earn $50,000 to $74,999.
13.0% of households in Corpus Christi earn $75,000 to $99,999.
16.3% of households in Corpus Christi earn $100,000 to $149,999.
7.5% of households in Corpus Christi earn $150,000 to $199,999.
7.7% of households in Corpus Christi earn $200,000 or more.
| Income | Corpus Christi | TX | USA |
|---|---|---|---|
| Less than $10,000 | 5.5% | 5.0% | 5.0% |
| $10,000 to $14,999 | 4.6% | 3.3% | 3.4% |
| $15,000 to $24,999 | 7.6% | 6.3% | 6.3% |
| $25,000 to $34,999 | 7.4% | 6.8% | 6.6% |
| $35,000 to $49,999 | 11.3% | 10.5% | 10.1% |
| $50,000 to $74,999 | 19.0% | 16.1% | 15.5% |
| $75,000 to $99,999 | 13.0% | 12.8% | 12.6% |
| $100,000 to $149,999 | 16.3% | 17.3% | 17.5% |
| $150,000 to $199,999 | 7.5% | 9.5% | 9.6% |
| $200,000 or more | 7.7% | 12.5% | 13.4% |
Source: U.S. Census ACS 5-year estimates (2024)


