Dripping Springs SnackAbility
Overall SnackAbility
Dripping Springs, TX Weather
The average high in Dripping Springs is 78.5° and the average low is 55.2°.
There are 51.8 days of precipitation each year.
Expect an average of 34.3 inches of precipitation each year with 0.6 inches of snow.
| Stat | Dripping Springs |
|---|---|
| Average Annual High | 78.5 |
| Average Annual Low | 55.2 |
| Annual Precipitation Days | 51.8 |
| Average Annual Precipitation | 34.3 |
| Average Annual Snowfall | 0.6 |
Average High
Days of Rain
Source: NOAA climate normals (30-year)
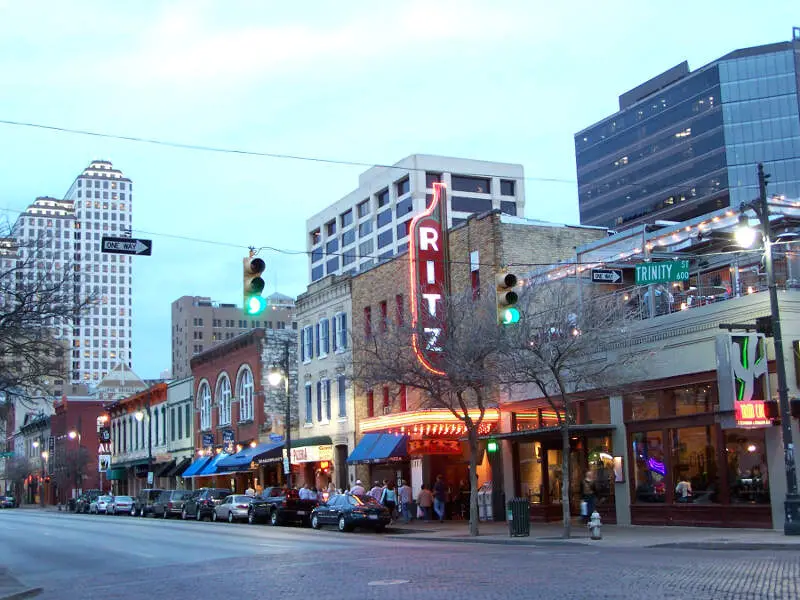
Dripping Springs, TX Photos
Rankings & Articles For Dripping Springs


Locations Around Dripping Springs
Map Of Dripping Springs, TX
Best Places Around Dripping Springs
Brushy Creek, TX
Population 19,576
Cedar Park, TX
Population 78,301
Round Rock, TX
Population 127,786
Fredericksburg, TX
Population 11,419
Pflugerville, TX
Population 65,971
Hutto, TX
Population 35,483
Cibolo, TX
Population 35,109
Converse, TX
Population 29,607
Leander, TX
Population 74,067
Georgetown, TX
Population 85,999
Dripping Springs Demographics And Statistics
Population over time in Dripping Springs
The current population in Dripping Springs is 7,405. The population has increased 281.1% from 2010.
| Year | Population | % Change |
|---|---|---|
| 2024 | 7,405 | 17.1% |
| 2023 | 6,322 | 15.1% |
| 2022 | 5,495 | 16.9% |
| 2021 | 4,699 | -5.1% |
| 2020 | 4,951 | 20.2% |
| 2019 | 4,119 | 25.7% |
| 2018 | 3,277 | 18.6% |
| 2017 | 2,764 | 14.8% |
| 2016 | 2,407 | -0.3% |
| 2015 | 2,415 | 15.7% |
| 2014 | 2,088 | 15.9% |
| 2013 | 1,801 | -4.7% |
| 2012 | 1,890 | -5.1% |
| 2011 | 1,991 | 2.5% |
| 2010 | 1,943 | - |
Race / Ethnicity in Dripping Springs
See the full breakdown
Dripping Springs is:
77.6% White with 5,749 White residents.
0.6% African American with 43 African American residents.
0.2% American Indian with 16 American Indian residents.
7.4% Asian with 551 Asian residents.
0.0% Hawaiian with 0 Hawaiian residents.
0.0% Other with 0 Other residents.
2.7% Two Or More with 200 Two Or More residents.
11.4% Hispanic with 846 Hispanic residents.
| Race | Dripping Springs | TX | USA |
|---|---|---|---|
| White | 77.6% | 39.1% | 57.4% |
| African American | 0.6% | 11.9% | 11.9% |
| American Indian | 0.2% | 0.1% | 0.5% |
| Asian | 7.4% | 5.5% | 5.9% |
| Hawaiian | 0.0% | 0.1% | 0.2% |
| Other | 0.0% | 0.4% | 0.6% |
| Two Or More | 2.7% | 3.1% | 4.3% |
| Hispanic | 11.4% | 39.7% | 19.3% |
Gender in Dripping Springs
See the full breakdown
Dripping Springs is 49.6% female with 3,671 female residents.
Dripping Springs is 50.4% male with 3,733 male residents.
| Gender | Dripping Springs | TX | USA |
|---|---|---|---|
| Female | 49.6% | 50.1% | 50.5% |
| Male | 50.4% | 49.9% | 49.5% |
Highest level of educational attainment in Dripping Springs for adults over 25
See the full breakdown
0.0% of adults in Dripping Springs completed < 9th grade.
2.0% of adults in Dripping Springs completed 9-12th grade.
7.0% of adults in Dripping Springs completed high school / ged.
18.0% of adults in Dripping Springs completed some college.
5.0% of adults in Dripping Springs completed associate's degree.
43.0% of adults in Dripping Springs completed bachelor's degree.
18.0% of adults in Dripping Springs completed master's degree.
3.0% of adults in Dripping Springs completed professional degree.
4.0% of adults in Dripping Springs completed doctorate degree.
| Education | Dripping Springs | TX | USA |
|---|---|---|---|
| < 9th Grade | 0.0% | 8.0% | 4.0% |
| 9-12th Grade | 2.0% | 7.0% | 6.0% |
| High School / GED | 7.0% | 24.0% | 26.0% |
| Some College | 18.0% | 20.0% | 19.0% |
| Associate's Degree | 5.0% | 8.0% | 9.0% |
| Bachelor's Degree | 43.0% | 21.0% | 22.0% |
| Master's Degree | 18.0% | 9.0% | 10.0% |
| Professional Degree | 3.0% | 2.0% | 2.0% |
| Doctorate Degree | 4.0% | 1.0% | 2.0% |
Household Income For Dripping Springs, Texas
See the full breakdown
0.5% of households in Dripping Springs earn Less than $10,000.
1.1% of households in Dripping Springs earn $10,000 to $14,999.
4.8% of households in Dripping Springs earn $15,000 to $24,999.
7.7% of households in Dripping Springs earn $25,000 to $34,999.
9.2% of households in Dripping Springs earn $35,000 to $49,999.
11.0% of households in Dripping Springs earn $50,000 to $74,999.
6.6% of households in Dripping Springs earn $75,000 to $99,999.
22.5% of households in Dripping Springs earn $100,000 to $149,999.
10.0% of households in Dripping Springs earn $150,000 to $199,999.
26.7% of households in Dripping Springs earn $200,000 or more.
| Income | Dripping Springs | TX | USA |
|---|---|---|---|
| Less than $10,000 | 0.5% | 5.0% | 5.0% |
| $10,000 to $14,999 | 1.1% | 3.3% | 3.4% |
| $15,000 to $24,999 | 4.8% | 6.3% | 6.3% |
| $25,000 to $34,999 | 7.7% | 6.8% | 6.6% |
| $35,000 to $49,999 | 9.2% | 10.5% | 10.1% |
| $50,000 to $74,999 | 11.0% | 16.1% | 15.5% |
| $75,000 to $99,999 | 6.6% | 12.8% | 12.6% |
| $100,000 to $149,999 | 22.5% | 17.3% | 17.5% |
| $150,000 to $199,999 | 10.0% | 9.5% | 9.6% |
| $200,000 or more | 26.7% | 12.5% | 13.4% |
Source: U.S. Census ACS 5-year estimates (2024)


