Compare Frisco to…
Frisco SnackAbility
Overall SnackAbility
Crime in Frisco summary. We use data from the FBI to determine the crime rates in Frisco. Key points include:
There were 2,571 total crimes in Frisco in the last reporting year.
The overall crime rate per 100,000 people in Frisco is 1,103.6 / 100k people.
The violent crime rate per 100,000 people in Frisco is 100.9 / 100k people.
The property crime rate per 100,000 people in Frisco is 1,002.7 / 100k people.
Overall, crime in Frisco is -47.92% below the national average.
Total Crimes
Below National Average
Crime In Frisco Comparison Table
| Statistic | Count Raw |
Frisco / 100k People |
Texas / 100k People |
National / 100k People |
|---|---|---|---|---|
| Total Crimes Per 100K | 2,571 | 1,103.6 | 2,429.9 | 2,119.2 |
| Violent Crime | 235 | 100.9 | 389.4 | 359.0 |
| Murder | 3 | 1.3 | 5.2 | 5.0 |
| Robbery | 29 | 12.4 | 63.5 | 61.0 |
| Aggravated Assault | 148 | 63.5 | 270.7 | 256.0 |
| Property Crime | 2,336 | 1,002.7 | 2,040.5 | 1,760.0 |
| Burglary | 159 | 68.3 | 284.3 | 229.0 |
| Larceny | 2,019 | 866.7 | 1,425.6 | 1,272.0 |
| Car Theft | 158 | 67.8 | 330.7 | 259.0 |
Source: FBI Uniform Crime Reporting (2024)
Cost of living in Frisco summary. We use data on the cost of living to determine how expensive it is to live in Frisco. Real estate prices drive most of the variance in cost of living around Texas. Key points include:
The cost of living in Frisco is 133 with 100 being average.
The cost of living in Frisco is 1.3x higher than the national average.
The median home value in Frisco is $656,757.
The median income in Frisco is $150,212.
Frisco's Overall Cost Of Living
Higher Than The National Average
Cost Of Living In Frisco Comparison Table
| Living Expense | Frisco | Texas | National Average |
|---|---|---|---|
| Overall | 133 | 93 | 100 |
| Services | 96 | 100 | 100 |
| Groceries | 95 | 99 | 100 |
| Health | 210 | 81 | 100 |
| Housing | 102 | 97 | 100 |
| Transportation | 99 | 103 | 100 |
| Utilities | 103 | 100 | 100 |
Source: Cost of living index, normalized to US average = 100
Frisco, TX Weather
The average high in Frisco is 75.5° and the average low is 53.9°.
There are 55.0 days of precipitation each year.
Expect an average of 39.7 inches of precipitation each year with 1.8 inches of snow.
| Stat | Frisco |
|---|---|
| Average Annual High | 75.5 |
| Average Annual Low | 53.9 |
| Annual Precipitation Days | 55.0 |
| Average Annual Precipitation | 39.7 |
| Average Annual Snowfall | 1.8 |
Average High
Days of Rain
Source: NOAA climate normals (30-year)
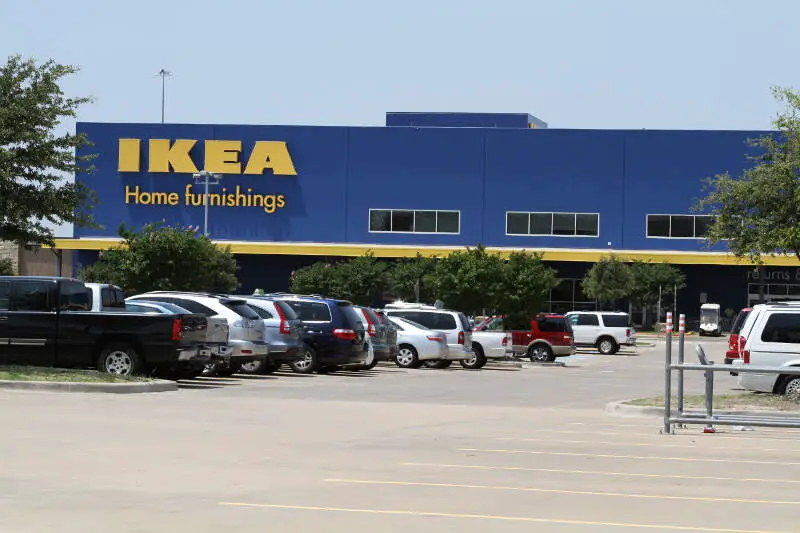
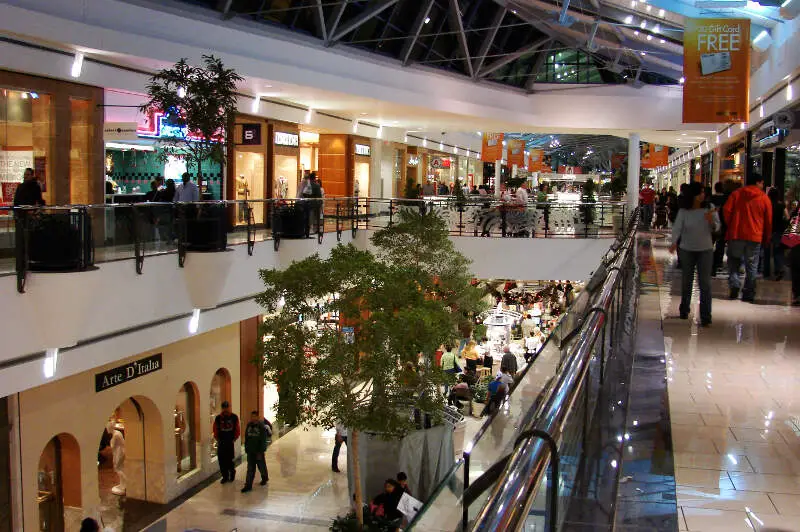
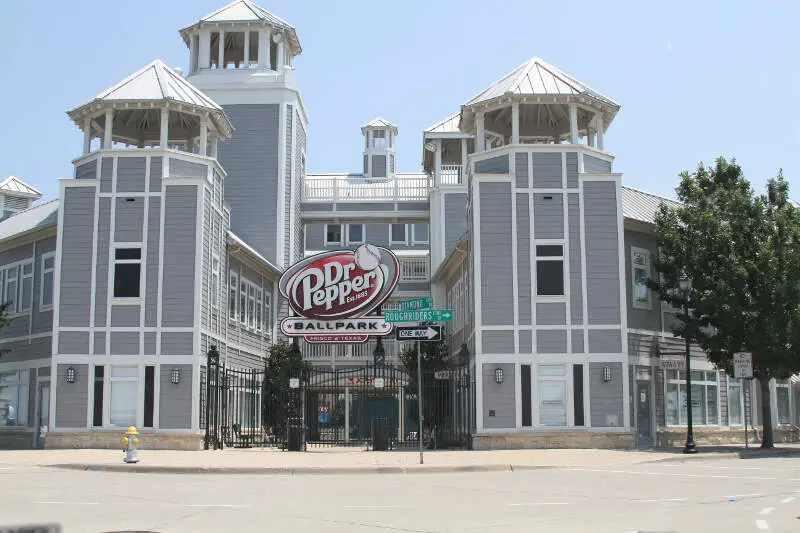
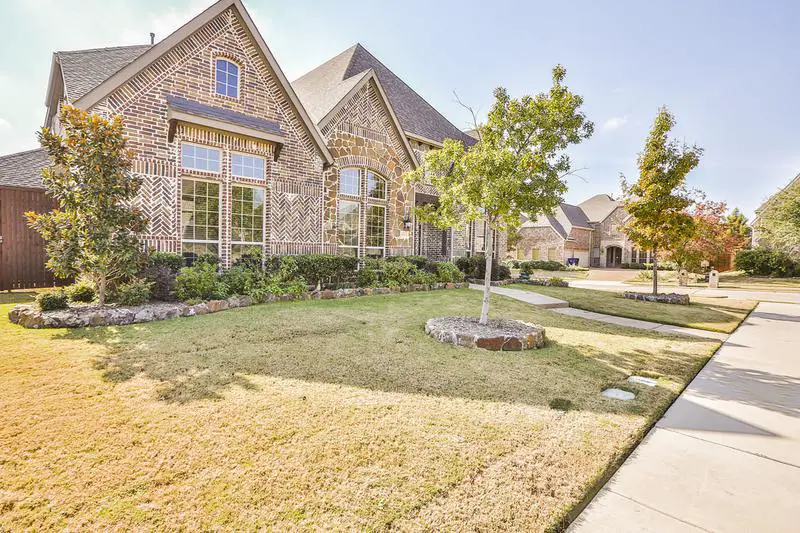
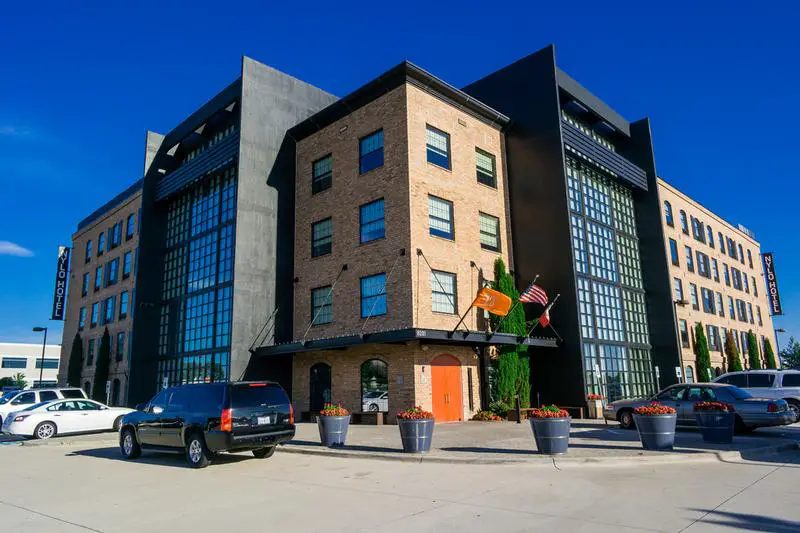
Frisco, TX Photos
1 Reviews & Comments About Frisco

I love Frisco, specifically Frisco Square, with its cozy vibe. It's a small area, but it has great restaurants, a library, movie theater, and senior center to keep it alive. In the winter, the whole place is alive with lights that create a very picturesque scene.
The people and restaurants stand out. The people are nice wherever you go, and there is a diversity of delicious restaurants, whether you're looking for casual or formal dining.
Rankings & Articles For Frisco


Locations Around Frisco
Map Of Frisco, TX
Best Places Around Frisco
Murphy, TX
Population 21,188
Allen, TX
Population 110,265
Corinth, TX
Population 23,385
Plano, TX
Population 290,594
Flower Mound, TX
Population 78,389
Coppell, TX
Population 42,154
Carrollton, TX
Population 133,740
Richardson, TX
Population 118,731
McKinney, TX
Population 210,600
The Colony, TX
Population 45,454
Frisco Demographics And Statistics
Population over time in Frisco
The current population in Frisco is 219,304. The population has increased 112.6% from 2010.
| Year | Population | % Change |
|---|---|---|
| 2024 | 219,304 | 4.3% |
| 2023 | 210,238 | 4.0% |
| 2022 | 202,075 | 4.6% |
| 2021 | 193,140 | 2.5% |
| 2020 | 188,387 | 6.4% |
| 2019 | 177,020 | 6.8% |
| 2018 | 165,700 | 6.7% |
| 2017 | 155,363 | 6.7% |
| 2016 | 145,646 | 5.7% |
| 2015 | 137,797 | 5.6% |
| 2014 | 130,499 | 5.5% |
| 2013 | 123,663 | 5.7% |
| 2012 | 116,944 | 6.3% |
| 2011 | 110,013 | 6.6% |
| 2010 | 103,158 | - |
Race / Ethnicity in Frisco
See the full breakdown
Frisco is:
45.8% White with 100,378 White residents.
9.0% African American with 19,677 African American residents.
0.1% American Indian with 245 American Indian residents.
28.1% Asian with 61,526 Asian residents.
0.0% Hawaiian with 12 Hawaiian residents.
0.5% Other with 1,193 Other residents.
3.8% Two Or More with 8,441 Two Or More residents.
12.7% Hispanic with 27,832 Hispanic residents.
| Race | Frisco | TX | USA |
|---|---|---|---|
| White | 45.8% | 39.1% | 57.4% |
| African American | 9.0% | 11.9% | 11.9% |
| American Indian | 0.1% | 0.1% | 0.5% |
| Asian | 28.1% | 5.5% | 5.9% |
| Hawaiian | 0.0% | 0.1% | 0.2% |
| Other | 0.5% | 0.4% | 0.6% |
| Two Or More | 3.8% | 3.1% | 4.3% |
| Hispanic | 12.7% | 39.7% | 19.3% |
Gender in Frisco
See the full breakdown
Frisco is 50.1% female with 109,877 female residents.
Frisco is 49.9% male with 109,427 male residents.
| Gender | Frisco | TX | USA |
|---|---|---|---|
| Female | 50.1% | 50.1% | 50.5% |
| Male | 49.9% | 49.9% | 49.5% |
Highest level of educational attainment in Frisco for adults over 25
See the full breakdown
1.0% of adults in Frisco completed < 9th grade.
2.0% of adults in Frisco completed 9-12th grade.
9.0% of adults in Frisco completed high school / ged.
14.0% of adults in Frisco completed some college.
6.0% of adults in Frisco completed associate's degree.
39.0% of adults in Frisco completed bachelor's degree.
24.0% of adults in Frisco completed master's degree.
3.0% of adults in Frisco completed professional degree.
2.0% of adults in Frisco completed doctorate degree.
| Education | Frisco | TX | USA |
|---|---|---|---|
| < 9th Grade | 1.0% | 8.0% | 4.0% |
| 9-12th Grade | 2.0% | 7.0% | 6.0% |
| High School / GED | 9.0% | 24.0% | 26.0% |
| Some College | 14.0% | 20.0% | 19.0% |
| Associate's Degree | 6.0% | 8.0% | 9.0% |
| Bachelor's Degree | 39.0% | 21.0% | 22.0% |
| Master's Degree | 24.0% | 9.0% | 10.0% |
| Professional Degree | 3.0% | 2.0% | 2.0% |
| Doctorate Degree | 2.0% | 1.0% | 2.0% |
Household Income For Frisco, Texas
See the full breakdown
2.3% of households in Frisco earn Less than $10,000.
0.6% of households in Frisco earn $10,000 to $14,999.
2.4% of households in Frisco earn $15,000 to $24,999.
2.3% of households in Frisco earn $25,000 to $34,999.
3.9% of households in Frisco earn $35,000 to $49,999.
10.1% of households in Frisco earn $50,000 to $74,999.
10.3% of households in Frisco earn $75,000 to $99,999.
18.1% of households in Frisco earn $100,000 to $149,999.
13.8% of households in Frisco earn $150,000 to $199,999.
36.2% of households in Frisco earn $200,000 or more.
| Income | Frisco | TX | USA |
|---|---|---|---|
| Less than $10,000 | 2.3% | 5.0% | 5.0% |
| $10,000 to $14,999 | 0.6% | 3.3% | 3.4% |
| $15,000 to $24,999 | 2.4% | 6.3% | 6.3% |
| $25,000 to $34,999 | 2.3% | 6.8% | 6.6% |
| $35,000 to $49,999 | 3.9% | 10.5% | 10.1% |
| $50,000 to $74,999 | 10.1% | 16.1% | 15.5% |
| $75,000 to $99,999 | 10.3% | 12.8% | 12.6% |
| $100,000 to $149,999 | 18.1% | 17.3% | 17.5% |
| $150,000 to $199,999 | 13.8% | 9.5% | 9.6% |
| $200,000 or more | 36.2% | 12.5% | 13.4% |
Source: U.S. Census ACS 5-year estimates (2024)


