Richardson SnackAbility
Overall SnackAbility
Crime in Richardson summary. We use data from the FBI to determine the crime rates in Richardson. Key points include:
There were 2,336 total crimes in Richardson in the last reporting year.
The overall crime rate per 100,000 people in Richardson is 1,980.3 / 100k people.
The violent crime rate per 100,000 people in Richardson is 146.7 / 100k people.
The property crime rate per 100,000 people in Richardson is 1,833.6 / 100k people.
Overall, crime in Richardson is -6.56% below the national average.
Total Crimes
Below National Average
Crime In Richardson Comparison Table
| Statistic | Count Raw |
Richardson / 100k People |
Texas / 100k People |
National / 100k People |
|---|---|---|---|---|
| Total Crimes Per 100K | 2,336 | 1,980.3 | 2,429.9 | 2,119.2 |
| Violent Crime | 173 | 146.7 | 389.4 | 359.0 |
| Murder | 2 | 1.7 | 5.2 | 5.0 |
| Robbery | 45 | 38.1 | 63.5 | 61.0 |
| Aggravated Assault | 116 | 98.3 | 270.7 | 256.0 |
| Property Crime | 2,163 | 1,833.6 | 2,040.5 | 1,760.0 |
| Burglary | 260 | 220.4 | 284.3 | 229.0 |
| Larceny | 1,528 | 1,295.3 | 1,425.6 | 1,272.0 |
| Car Theft | 375 | 317.9 | 330.7 | 259.0 |
Source: FBI Uniform Crime Reporting (2024)
Cost of living in Richardson summary. We use data on the cost of living to determine how expensive it is to live in Richardson. Real estate prices drive most of the variance in cost of living around Texas. Key points include:
The cost of living in Richardson is 116 with 100 being average.
The cost of living in Richardson is 1.2x higher than the national average.
The median home value in Richardson is $440,400.
The median income in Richardson is $98,111.
Richardson's Overall Cost Of Living
Higher Than The National Average
Cost Of Living In Richardson Comparison Table
| Living Expense | Richardson | Texas | National Average |
|---|---|---|---|
| Overall | 116 | 93 | 100 |
| Services | 100 | 100 | 100 |
| Groceries | 98 | 99 | 100 |
| Health | 157 | 81 | 100 |
| Housing | 99 | 97 | 100 |
| Transportation | 105 | 103 | 100 |
| Utilities | 92 | 100 | 100 |
Source: Cost of living index, normalized to US average = 100
Richardson, TX Weather
The average high in Richardson is 75.8° and the average low is 54.9°.
There are 57.6 days of precipitation each year.
Expect an average of 40.2 inches of precipitation each year with 1.5 inches of snow.
| Stat | Richardson |
|---|---|
| Average Annual High | 75.8 |
| Average Annual Low | 54.9 |
| Annual Precipitation Days | 57.6 |
| Average Annual Precipitation | 40.2 |
| Average Annual Snowfall | 1.5 |
Average High
Days of Rain
Source: NOAA climate normals (30-year)
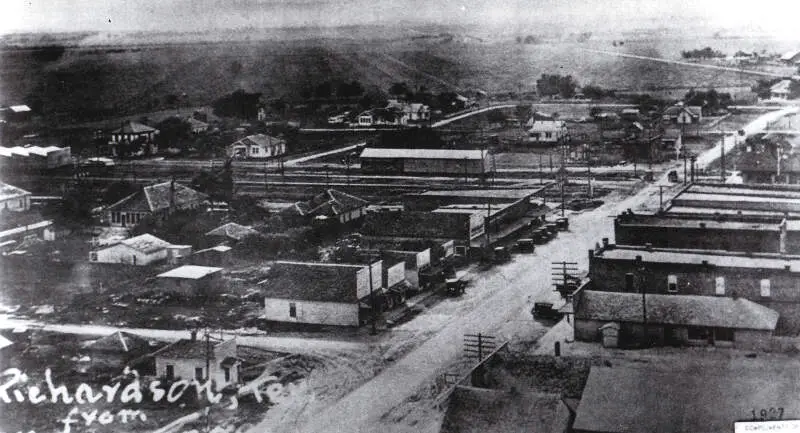
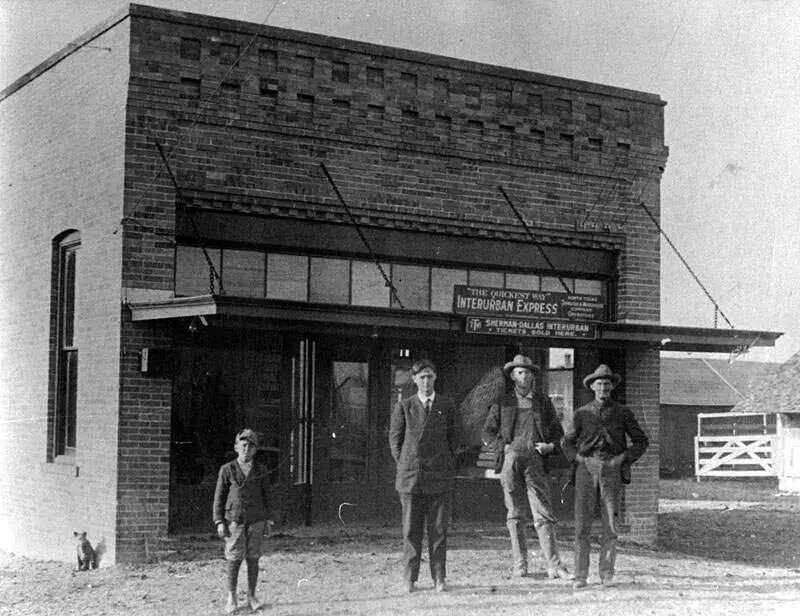
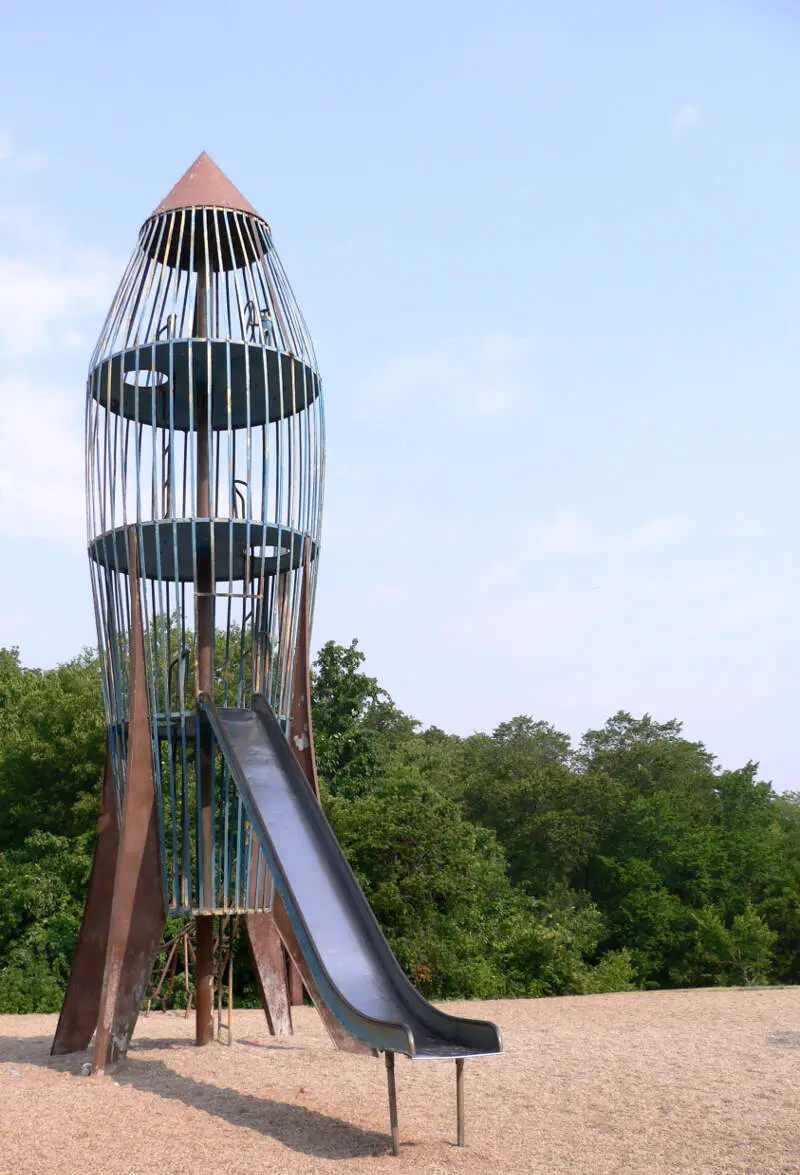
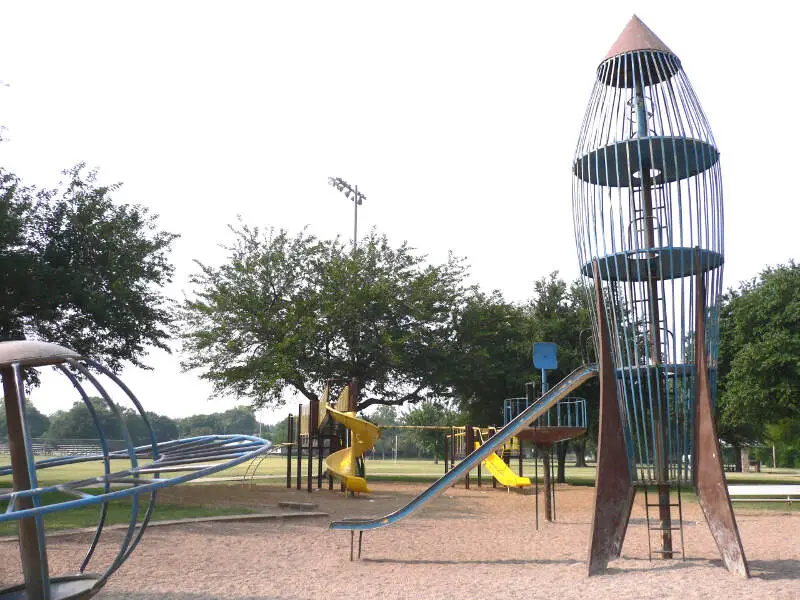
Richardson, TX Photos

Rankings & Articles For Richardson


Locations Around Richardson
Map Of Richardson, TX
Best Places Around Richardson
Murphy, TX
Population 21,188
Allen, TX
Population 110,265
Plano, TX
Population 290,594
Frisco, TX
Population 219,304
University Park, TX
Population 25,155
Coppell, TX
Population 42,154
Carrollton, TX
Population 133,740
McKinney, TX
Population 210,600
The Colony, TX
Population 45,454
Lewisville, TX
Population 131,080
Richardson Demographics And Statistics
Population over time in Richardson
The current population in Richardson is 118,731. The population has increased 21.8% from 2010.
| Year | Population | % Change |
|---|---|---|
| 2024 | 118,731 | 0.4% |
| 2023 | 118,269 | 0.2% |
| 2022 | 118,063 | 1.9% |
| 2021 | 115,904 | -2.3% |
| 2020 | 118,583 | 1.8% |
| 2019 | 116,432 | 1.8% |
| 2018 | 114,402 | 3.0% |
| 2017 | 111,055 | 2.5% |
| 2016 | 108,350 | 2.1% |
| 2015 | 106,123 | 2.3% |
| 2014 | 103,752 | 2.2% |
| 2013 | 101,528 | 1.5% |
| 2012 | 100,057 | 1.4% |
| 2011 | 98,710 | 1.2% |
| 2010 | 97,507 | - |
Race / Ethnicity in Richardson
See the full breakdown
Richardson is:
49.2% White with 58,459 White residents.
11.6% African American with 13,744 African American residents.
0.1% American Indian with 155 American Indian residents.
16.1% Asian with 19,082 Asian residents.
0.0% Hawaiian with 36 Hawaiian residents.
0.7% Other with 788 Other residents.
4.0% Two Or More with 4,774 Two Or More residents.
18.3% Hispanic with 21,693 Hispanic residents.
| Race | Richardson | TX | USA |
|---|---|---|---|
| White | 49.2% | 39.1% | 57.4% |
| African American | 11.6% | 11.9% | 11.9% |
| American Indian | 0.1% | 0.1% | 0.5% |
| Asian | 16.1% | 5.5% | 5.9% |
| Hawaiian | 0.0% | 0.1% | 0.2% |
| Other | 0.7% | 0.4% | 0.6% |
| Two Or More | 4.0% | 3.1% | 4.3% |
| Hispanic | 18.3% | 39.7% | 19.3% |
Gender in Richardson
See the full breakdown
Richardson is 51.9% female with 61,646 female residents.
Richardson is 48.1% male with 57,085 male residents.
| Gender | Richardson | TX | USA |
|---|---|---|---|
| Female | 51.9% | 50.1% | 50.5% |
| Male | 48.1% | 49.9% | 49.5% |
Highest level of educational attainment in Richardson for adults over 25
See the full breakdown
5.0% of adults in Richardson completed < 9th grade.
3.0% of adults in Richardson completed 9-12th grade.
12.0% of adults in Richardson completed high school / ged.
16.0% of adults in Richardson completed some college.
8.0% of adults in Richardson completed associate's degree.
33.0% of adults in Richardson completed bachelor's degree.
17.0% of adults in Richardson completed master's degree.
4.0% of adults in Richardson completed professional degree.
2.0% of adults in Richardson completed doctorate degree.
| Education | Richardson | TX | USA |
|---|---|---|---|
| < 9th Grade | 5.0% | 8.0% | 4.0% |
| 9-12th Grade | 3.0% | 7.0% | 6.0% |
| High School / GED | 12.0% | 24.0% | 26.0% |
| Some College | 16.0% | 20.0% | 19.0% |
| Associate's Degree | 8.0% | 8.0% | 9.0% |
| Bachelor's Degree | 33.0% | 21.0% | 22.0% |
| Master's Degree | 17.0% | 9.0% | 10.0% |
| Professional Degree | 4.0% | 2.0% | 2.0% |
| Doctorate Degree | 2.0% | 1.0% | 2.0% |
Household Income For Richardson, Texas
See the full breakdown
5.5% of households in Richardson earn Less than $10,000.
1.6% of households in Richardson earn $10,000 to $14,999.
3.6% of households in Richardson earn $15,000 to $24,999.
3.7% of households in Richardson earn $25,000 to $34,999.
8.6% of households in Richardson earn $35,000 to $49,999.
14.5% of households in Richardson earn $50,000 to $74,999.
13.2% of households in Richardson earn $75,000 to $99,999.
19.6% of households in Richardson earn $100,000 to $149,999.
11.9% of households in Richardson earn $150,000 to $199,999.
17.7% of households in Richardson earn $200,000 or more.
| Income | Richardson | TX | USA |
|---|---|---|---|
| Less than $10,000 | 5.5% | 5.0% | 5.0% |
| $10,000 to $14,999 | 1.6% | 3.3% | 3.4% |
| $15,000 to $24,999 | 3.6% | 6.3% | 6.3% |
| $25,000 to $34,999 | 3.7% | 6.8% | 6.6% |
| $35,000 to $49,999 | 8.6% | 10.5% | 10.1% |
| $50,000 to $74,999 | 14.5% | 16.1% | 15.5% |
| $75,000 to $99,999 | 13.2% | 12.8% | 12.6% |
| $100,000 to $149,999 | 19.6% | 17.3% | 17.5% |
| $150,000 to $199,999 | 11.9% | 9.5% | 9.6% |
| $200,000 or more | 17.7% | 12.5% | 13.4% |
Source: U.S. Census ACS 5-year estimates (2024)


