Hillsboro SnackAbility
Overall SnackAbility
Crime in Hillsboro summary. We use data from the FBI to determine the crime rates in Hillsboro. Key points include:
There were 177 total crimes in Hillsboro in the last reporting year.
The overall crime rate per 100,000 people in Hillsboro is 1,994.6 / 100k people.
The violent crime rate per 100,000 people in Hillsboro is 135.2 / 100k people.
The property crime rate per 100,000 people in Hillsboro is 1,859.4 / 100k people.
Overall, crime in Hillsboro is -5.88% below the national average.
Total Crimes
Below National Average
Crime In Hillsboro Comparison Table
| Statistic | Count Raw |
Hillsboro / 100k People |
Texas / 100k People |
National / 100k People |
|---|---|---|---|---|
| Total Crimes Per 100K | 177 | 1,994.6 | 2,429.9 | 2,119.2 |
| Violent Crime | 12 | 135.2 | 389.4 | 359.0 |
| Murder | 0 | 0.0 | 5.2 | 5.0 |
| Robbery | 1 | 11.3 | 63.5 | 61.0 |
| Aggravated Assault | 3 | 33.8 | 270.7 | 256.0 |
| Property Crime | 165 | 1,859.4 | 2,040.5 | 1,760.0 |
| Burglary | 31 | 349.3 | 284.3 | 229.0 |
| Larceny | 125 | 1,408.6 | 1,425.6 | 1,272.0 |
| Car Theft | 9 | 101.4 | 330.7 | 259.0 |
Source: FBI Uniform Crime Reporting (2024)
Cost of living in Hillsboro summary. We use data on the cost of living to determine how expensive it is to live in Hillsboro. Real estate prices drive most of the variance in cost of living around Texas. Key points include:
The cost of living in Hillsboro is 84 with 100 being average.
The cost of living in Hillsboro is 0.8x lower than the national average.
The median home value in Hillsboro is $201,862.
The median income in Hillsboro is $56,083.
Hillsboro's Overall Cost Of Living
Lower Than The National Average
Cost Of Living In Hillsboro Comparison Table
| Living Expense | Hillsboro | Texas | National Average |
|---|---|---|---|
| Overall | 84 | 93 | 100 |
| Services | 99 | 100 | 100 |
| Groceries | 98 | 99 | 100 |
| Health | 58 | 81 | 100 |
| Housing | 94 | 97 | 100 |
| Transportation | 99 | 103 | 100 |
| Utilities | 97 | 100 | 100 |
Source: Cost of living index, normalized to US average = 100
Hillsboro, TX Weather
The average high in Hillsboro is 76.9° and the average low is 54.9°.
There are 55.0 days of precipitation each year.
Expect an average of 37.6 inches of precipitation each year with 0.5 inches of snow.
| Stat | Hillsboro |
|---|---|
| Average Annual High | 76.9 |
| Average Annual Low | 54.9 |
| Annual Precipitation Days | 55.0 |
| Average Annual Precipitation | 37.6 |
| Average Annual Snowfall | 0.5 |
Average High
Days of Rain
Source: NOAA climate normals (30-year)
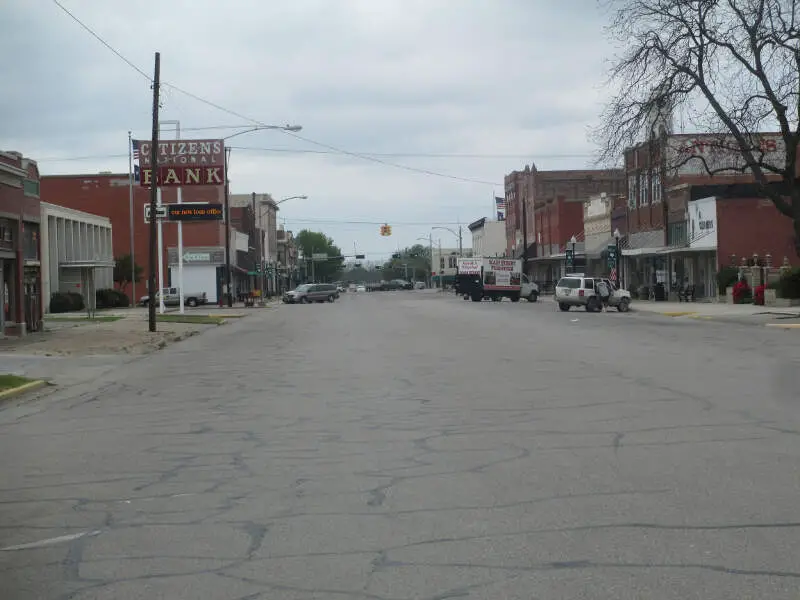
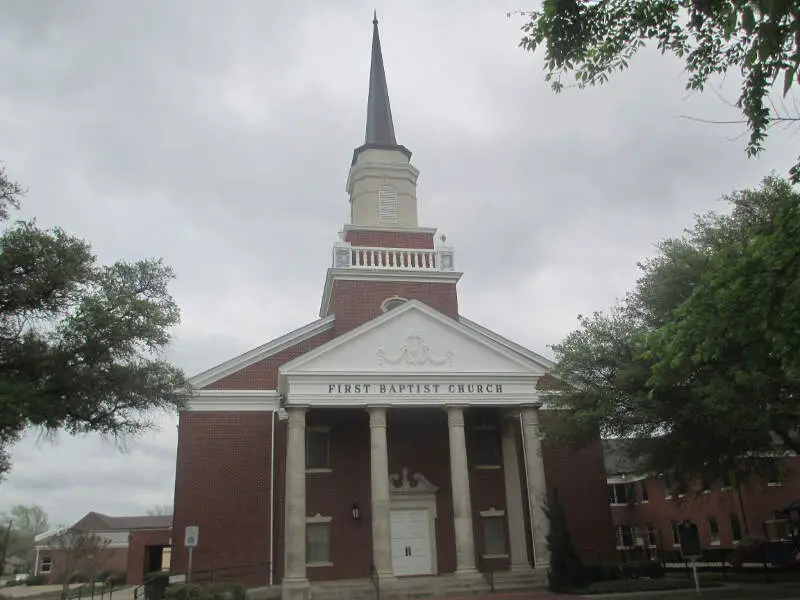
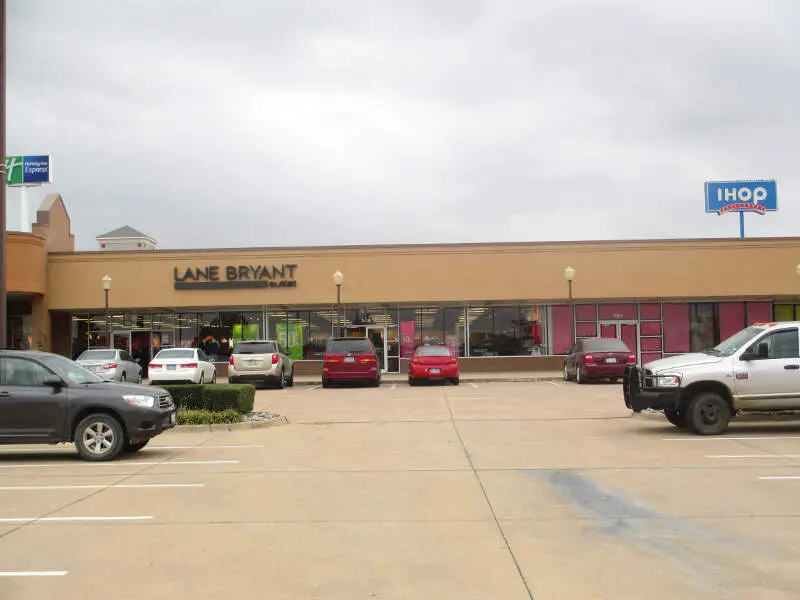
Hillsboro, TX Photos


Rankings & Articles For Hillsboro


Locations Around Hillsboro
Map Of Hillsboro, TX
Best Places Around Hillsboro
Hewitt, TX
Population 16,432
Robinson, TX
Population 12,800
Mansfield, TX
Population 77,510
Burleson, TX
Population 52,918
Arlington, TX
Population 397,742
Rendon, TX
Population 14,632
Crowley, TX
Population 19,532
Forest Hill, TX
Population 14,062
Duncanville, TX
Population 39,683
Waxahachie, TX
Population 45,347
Hillsboro Demographics And Statistics
Population over time in Hillsboro
The current population in Hillsboro is 8,506. The population has decreased 0.1% from 2010.
| Year | Population | % Change |
|---|---|---|
| 2024 | 8,506 | 1.6% |
| 2023 | 8,375 | 1.1% |
| 2022 | 8,281 | 1.1% |
| 2021 | 8,193 | -2.3% |
| 2020 | 8,384 | 0.5% |
| 2019 | 8,342 | 0.1% |
| 2018 | 8,333 | 0.1% |
| 2017 | 8,325 | -0.4% |
| 2016 | 8,358 | -0.0% |
| 2015 | 8,360 | -0.4% |
| 2014 | 8,394 | -0.4% |
| 2013 | 8,429 | -0.4% |
| 2012 | 8,461 | -0.5% |
| 2011 | 8,500 | -0.2% |
| 2010 | 8,514 | - |
Race / Ethnicity in Hillsboro
See the full breakdown
Hillsboro is:
45.3% White with 3,852 White residents.
10.5% African American with 896 African American residents.
0.1% American Indian with 6 American Indian residents.
0.2% Asian with 17 Asian residents.
0.0% Hawaiian with 0 Hawaiian residents.
0.0% Other with 0 Other residents.
3.9% Two Or More with 331 Two Or More residents.
40.0% Hispanic with 3,404 Hispanic residents.
| Race | Hillsboro | TX | USA |
|---|---|---|---|
| White | 45.3% | 39.1% | 57.4% |
| African American | 10.5% | 11.9% | 11.9% |
| American Indian | 0.1% | 0.1% | 0.5% |
| Asian | 0.2% | 5.5% | 5.9% |
| Hawaiian | 0.0% | 0.1% | 0.2% |
| Other | 0.0% | 0.4% | 0.6% |
| Two Or More | 3.9% | 3.1% | 4.3% |
| Hispanic | 40.0% | 39.7% | 19.3% |
Gender in Hillsboro
See the full breakdown
Hillsboro is 53.2% female with 4,525 female residents.
Hillsboro is 46.8% male with 3,981 male residents.
| Gender | Hillsboro | TX | USA |
|---|---|---|---|
| Female | 53.2% | 50.1% | 50.5% |
| Male | 46.8% | 49.9% | 49.5% |
Highest level of educational attainment in Hillsboro for adults over 25
See the full breakdown
10.0% of adults in Hillsboro completed < 9th grade.
10.0% of adults in Hillsboro completed 9-12th grade.
30.0% of adults in Hillsboro completed high school / ged.
22.0% of adults in Hillsboro completed some college.
13.0% of adults in Hillsboro completed associate's degree.
10.0% of adults in Hillsboro completed bachelor's degree.
5.0% of adults in Hillsboro completed master's degree.
0.0% of adults in Hillsboro completed professional degree.
0.0% of adults in Hillsboro completed doctorate degree.
| Education | Hillsboro | TX | USA |
|---|---|---|---|
| < 9th Grade | 10.0% | 8.0% | 4.0% |
| 9-12th Grade | 10.0% | 7.0% | 6.0% |
| High School / GED | 30.0% | 24.0% | 26.0% |
| Some College | 22.0% | 20.0% | 19.0% |
| Associate's Degree | 13.0% | 8.0% | 9.0% |
| Bachelor's Degree | 10.0% | 21.0% | 22.0% |
| Master's Degree | 5.0% | 9.0% | 10.0% |
| Professional Degree | 0.0% | 2.0% | 2.0% |
| Doctorate Degree | 0.0% | 1.0% | 2.0% |
Household Income For Hillsboro, Texas
See the full breakdown
7.7% of households in Hillsboro earn Less than $10,000.
4.8% of households in Hillsboro earn $10,000 to $14,999.
11.6% of households in Hillsboro earn $15,000 to $24,999.
7.5% of households in Hillsboro earn $25,000 to $34,999.
12.4% of households in Hillsboro earn $35,000 to $49,999.
21.5% of households in Hillsboro earn $50,000 to $74,999.
9.8% of households in Hillsboro earn $75,000 to $99,999.
17.1% of households in Hillsboro earn $100,000 to $149,999.
4.6% of households in Hillsboro earn $150,000 to $199,999.
3.0% of households in Hillsboro earn $200,000 or more.
| Income | Hillsboro | TX | USA |
|---|---|---|---|
| Less than $10,000 | 7.7% | 5.0% | 5.0% |
| $10,000 to $14,999 | 4.8% | 3.3% | 3.4% |
| $15,000 to $24,999 | 11.6% | 6.3% | 6.3% |
| $25,000 to $34,999 | 7.5% | 6.8% | 6.6% |
| $35,000 to $49,999 | 12.4% | 10.5% | 10.1% |
| $50,000 to $74,999 | 21.5% | 16.1% | 15.5% |
| $75,000 to $99,999 | 9.8% | 12.8% | 12.6% |
| $100,000 to $149,999 | 17.1% | 17.3% | 17.5% |
| $150,000 to $199,999 | 4.6% | 9.5% | 9.6% |
| $200,000 or more | 3.0% | 12.5% | 13.4% |
Source: U.S. Census ACS 5-year estimates (2024)


