Kilgore, TX
Demographics And Statistics
Living In Kilgore, Texas Summary
Life in Kilgore research summary. HomeSnacks has been using Saturday Night Science to research the quality of life in Kilgore over the past nine years using Census, FBI, Zillow, and other primary data sources. Based on the most recently available data, we found the following about life in Kilgore:
The population in Kilgore is 13,444.
The median home value in Kilgore is $207,971.
The median income in Kilgore is $58,141.
The cost of living in Kilgore is 92 which is 0.9x lower than the national average.
The median rent in Kilgore is $1,082.
The unemployment rate in Kilgore is 3.9%.
The poverty rate in Kilgore is 19.6%.
The average high in Kilgore is 76.3° and the average low is 53.8°.
Kilgore SnackAbility
Overall SnackAbility
Kilgore, TX Crime Report
Crime in Kilgore summary. We use data from the FBI to determine the crime rates in Kilgore. Key points include:
There were 344 total crimes in Kilgore in the last reporting year.
The overall crime rate per 100,000 people in Kilgore is 2,534.6 / 100k people.
The violent crime rate per 100,000 people in Kilgore is 338.9 / 100k people.
The property crime rate per 100,000 people in Kilgore is 2,195.7 / 100k people.
Overall, crime in Kilgore is 19.60% above the national average.
Total Crimes
Above National Average
Crime In Kilgore Comparison Table
| Statistic | Count Raw |
Kilgore / 100k People |
Texas / 100k People |
National / 100k People |
|---|---|---|---|---|
| Total Crimes Per 100K | 344 | 2,534.6 | 2,429.9 | 2,119.2 |
| Violent Crime | 46 | 338.9 | 389.4 | 359.0 |
| Murder | 1 | 7.4 | 5.2 | 5.0 |
| Robbery | 3 | 22.1 | 63.5 | 61.0 |
| Aggravated Assault | 35 | 257.9 | 270.7 | 256.0 |
| Property Crime | 298 | 2,195.7 | 2,040.5 | 1,760.0 |
| Burglary | 37 | 272.6 | 284.3 | 229.0 |
| Larceny | 237 | 1,746.2 | 1,425.6 | 1,272.0 |
| Car Theft | 24 | 176.8 | 330.7 | 259.0 |
Kilgore, TX Cost Of Living
Cost of living in Kilgore summary. We use data on the cost of living to determine how expensive it is to live in Kilgore. Real estate prices drive most of the variance in cost of living around Texas. Key points include:
The cost of living in Kilgore is 92 with 100 being average.
The cost of living in Kilgore is 0.9x lower than the national average.
The median home value in Kilgore is $207,971.
The median income in Kilgore is $58,141.
Kilgore's Overall Cost Of Living
Lower Than The National Average
Cost Of Living In Kilgore Comparison Table
| Living Expense | Kilgore | Texas | National Average | |
|---|---|---|---|---|
| Overall | 92 | 92 | 100 | |
| Services | 99 | 97 | 100 | |
| Groceries | 100 | 97 | 100 | |
| Health | 89 | 93 | 100 | |
| Housing | 73 | 82 | 100 | |
| Transportation | 93 | 94 | 100 | |
| Utilities | 115 | 104 | 100 | |
Kilgore, TX Weather
The average high in Kilgore is 76.3° and the average low is 53.8°.
There are 63.4 days of precipitation each year.
Expect an average of 46.9 inches of precipitation each year with 0.7 inches of snow.
| Stat | Kilgore |
|---|---|
| Average Annual High | 76.3 |
| Average Annual Low | 53.8 |
| Annual Precipitation Days | 63.4 |
| Average Annual Precipitation | 46.9 |
| Average Annual Snowfall | 0.7 |
Average High
Days of Rain
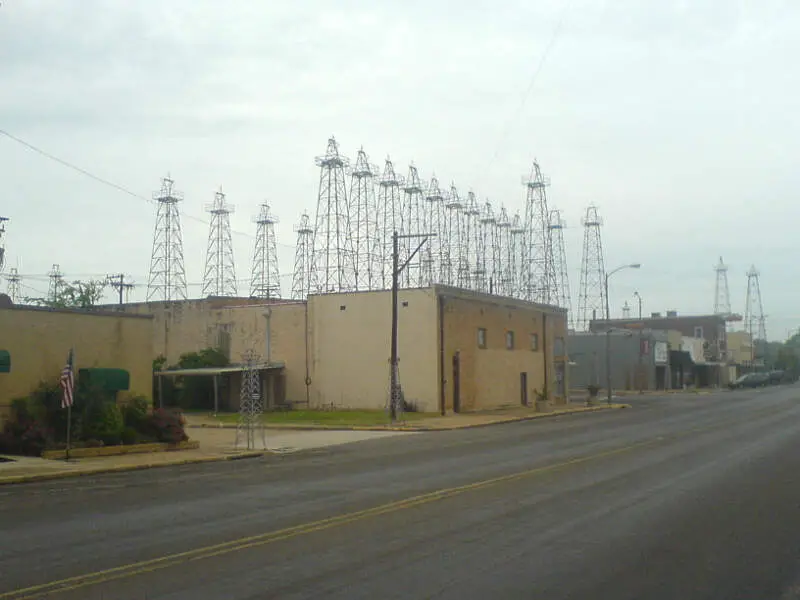
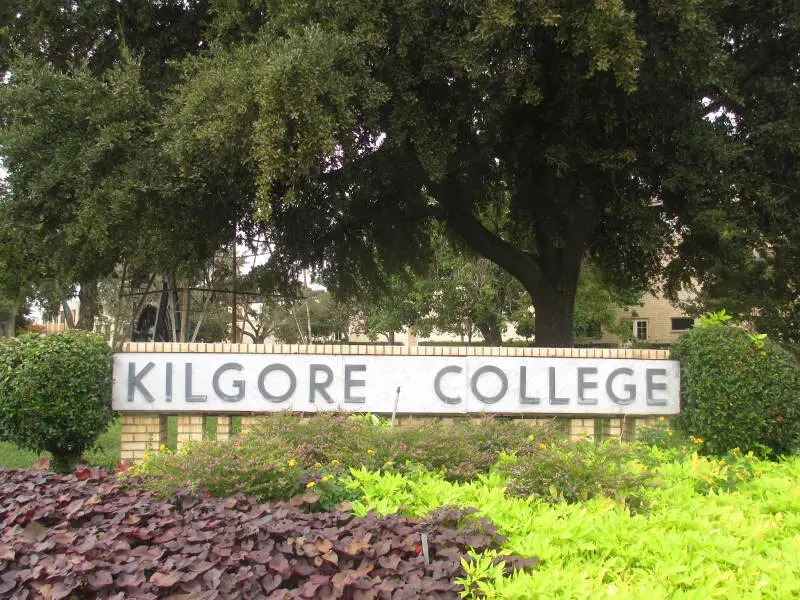
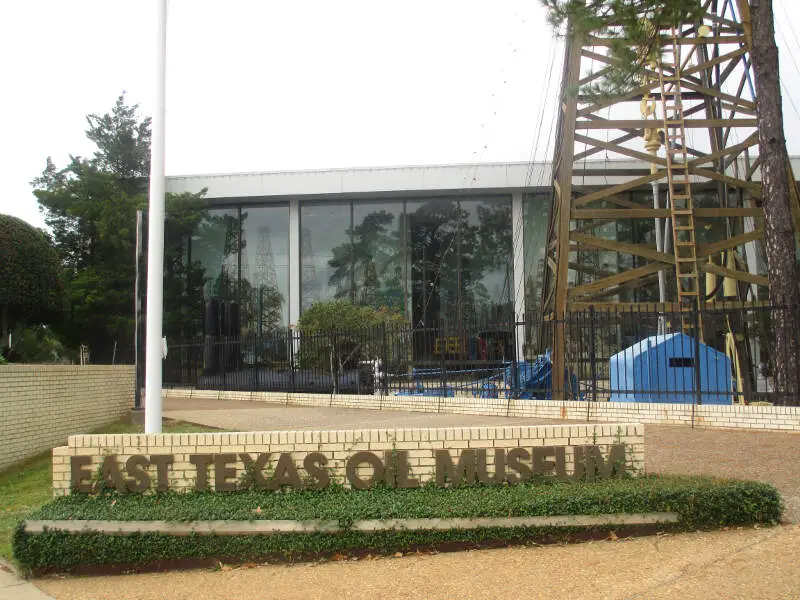
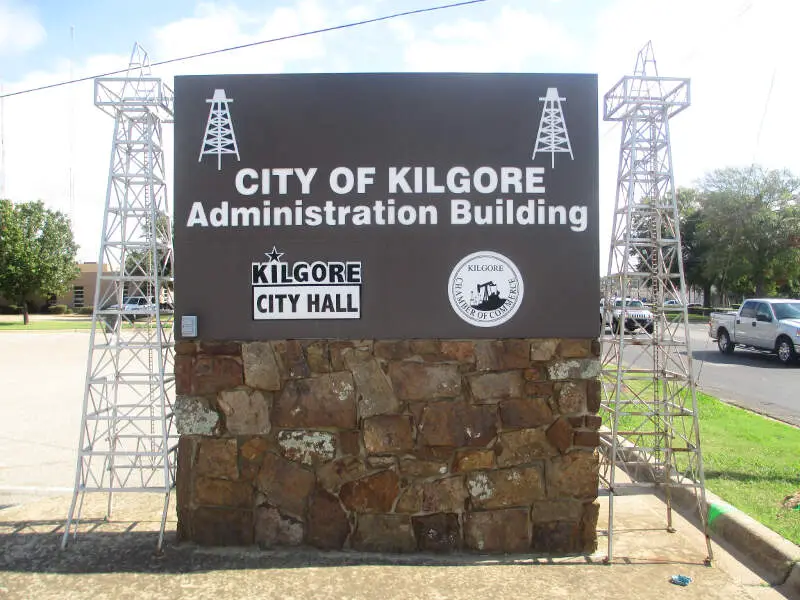
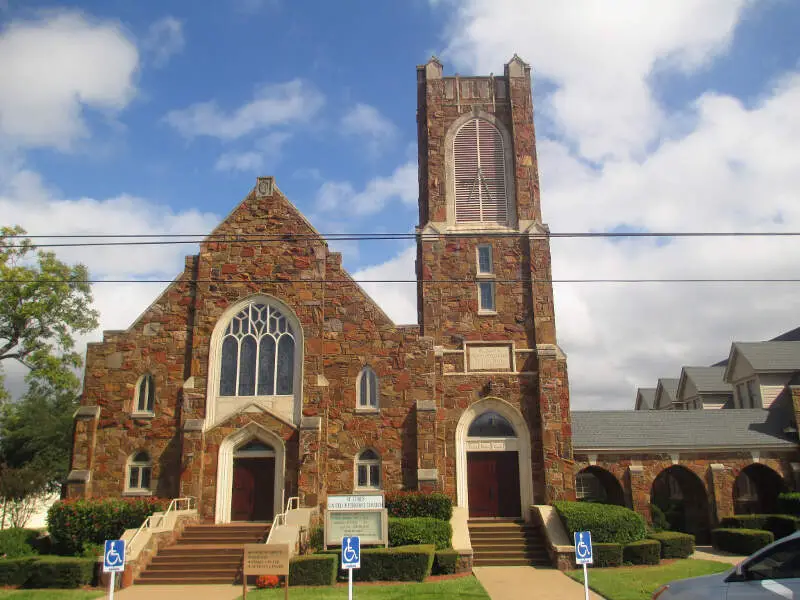
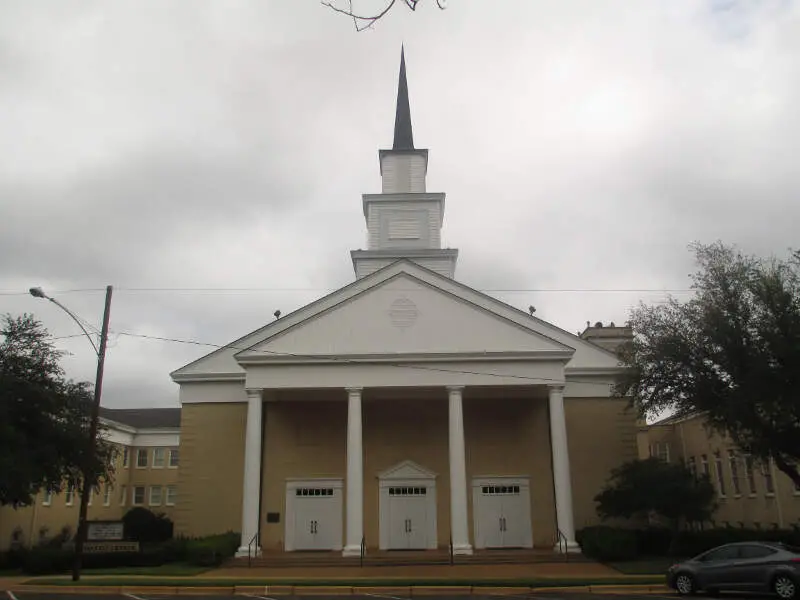
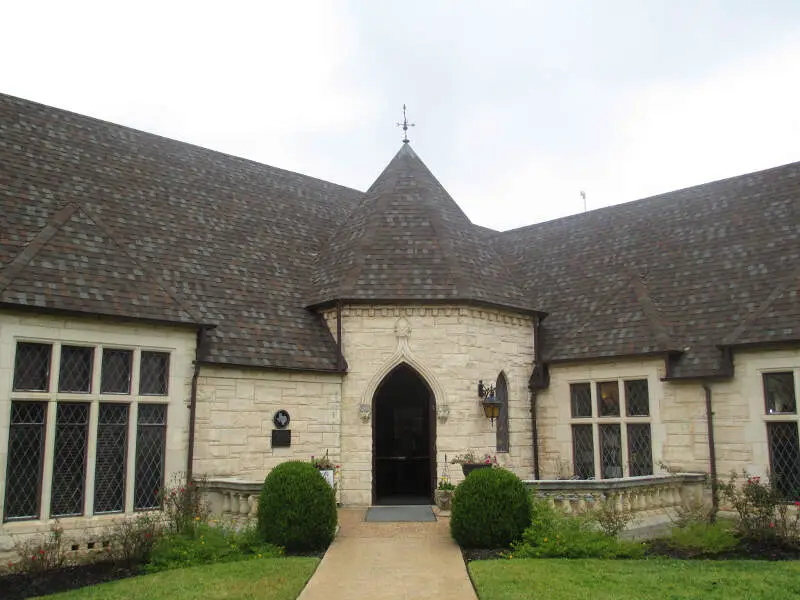
Kilgore, TX Photos


Rankings for Kilgore in Texas


Locations Around Kilgore
Map Of Kilgore, TX
Best Places Around Kilgore
Longview, TX
Population 82,765
Tyler, TX
Population 107,718
Henderson, TX
Population 13,348
Marshall, TX
Population 23,646
Jacksonville, TX
Population 14,186
Kilgore Demographics And Statistics
Population over time in Kilgore
The current population in Kilgore is 13,444. The population has increased 5.8% from 2010.
| Year | Population | % Change |
|---|---|---|
| 2023 | 13,444 | 0.3% |
| 2022 | 13,400 | 0.3% |
| 2021 | 13,364 | -9.8% |
| 2020 | 14,824 | -0.0% |
| 2019 | 14,827 | -0.3% |
| 2018 | 14,867 | 0.6% |
| 2017 | 14,784 | 0.9% |
| 2016 | 14,658 | 1.5% |
| 2015 | 14,442 | 1.9% |
| 2014 | 14,178 | 3.3% |
| 2013 | 13,731 | 4.3% |
| 2012 | 13,165 | 2.5% |
| 2011 | 12,844 | 1.1% |
| 2010 | 12,706 | - |
Race / Ethnicity in Kilgore
Kilgore is:
50.7% White with 6,814 White residents.
13.6% African American with 1,826 African American residents.
0.1% American Indian with 10 American Indian residents.
0.9% Asian with 118 Asian residents.
0.0% Hawaiian with 0 Hawaiian residents.
0.0% Other with 0 Other residents.
6.6% Two Or More with 894 Two Or More residents.
28.1% Hispanic with 3,782 Hispanic residents.
| Race | Kilgore | TX | USA |
|---|---|---|---|
| White | 50.7% | 39.9% | 58.2% |
| African American | 13.6% | 11.9% | 12.0% |
| American Indian | 0.1% | 0.2% | 0.5% |
| Asian | 0.9% | 5.3% | 5.7% |
| Hawaiian | 0.0% | 0.1% | 0.2% |
| Other | 0.0% | 0.4% | 0.5% |
| Two Or More | 6.6% | 2.9% | 3.9% |
| Hispanic | 28.1% | 39.5% | 19.0% |
Gender in Kilgore
Kilgore is 51.1% female with 6,872 female residents.
Kilgore is 48.9% male with 6,571 male residents.
| Gender | Kilgore | TX | USA |
|---|---|---|---|
| Female | 51.1% | 50.1% | 50.5% |
| Male | 48.9% | 49.9% | 49.5% |
Highest level of educational attainment in Kilgore for adults over 25
5.0% of adults in Kilgore completed < 9th grade.
14.0% of adults in Kilgore completed 9-12th grade.
30.0% of adults in Kilgore completed high school / ged.
21.0% of adults in Kilgore completed some college.
10.0% of adults in Kilgore completed associate's degree.
14.0% of adults in Kilgore completed bachelor's degree.
4.0% of adults in Kilgore completed master's degree.
1.0% of adults in Kilgore completed professional degree.
1.0% of adults in Kilgore completed doctorate degree.
| Education | Kilgore | TX | USA |
|---|---|---|---|
| < 9th Grade | 5.0% | 7.0% | 5.0% |
| 9-12th Grade | 14.0% | 7.0% | 6.0% |
| High School / GED | 30.0% | 24.0% | 26.0% |
| Some College | 21.0% | 21.0% | 19.0% |
| Associate's Degree | 10.0% | 8.0% | 9.0% |
| Bachelor's Degree | 14.0% | 21.0% | 21.0% |
| Master's Degree | 4.0% | 9.0% | 10.0% |
| Professional Degree | 1.0% | 2.0% | 2.0% |
| Doctorate Degree | 1.0% | 1.0% | 2.0% |
Household Income For Kilgore, Texas
10.3% of households in Kilgore earn Less than $10,000.
0.8% of households in Kilgore earn $10,000 to $14,999.
10.8% of households in Kilgore earn $15,000 to $24,999.
8.1% of households in Kilgore earn $25,000 to $34,999.
14.4% of households in Kilgore earn $35,000 to $49,999.
15.9% of households in Kilgore earn $50,000 to $74,999.
16.6% of households in Kilgore earn $75,000 to $99,999.
14.1% of households in Kilgore earn $100,000 to $149,999.
4.6% of households in Kilgore earn $150,000 to $199,999.
4.3% of households in Kilgore earn $200,000 or more.
| Income | Kilgore | TX | USA |
|---|---|---|---|
| Less than $10,000 | 10.3% | 5.0% | 4.9% |
| $10,000 to $14,999 | 0.8% | 3.4% | 3.6% |
| $15,000 to $24,999 | 10.8% | 6.5% | 6.6% |
| $25,000 to $34,999 | 8.1% | 7.0% | 6.8% |
| $35,000 to $49,999 | 14.4% | 10.9% | 10.4% |
| $50,000 to $74,999 | 15.9% | 16.4% | 15.7% |
| $75,000 to $99,999 | 16.6% | 12.8% | 12.7% |
| $100,000 to $149,999 | 14.1% | 17.2% | 17.4% |
| $150,000 to $199,999 | 4.6% | 9.1% | 9.3% |
| $200,000 or more | 4.3% | 11.7% | 12.6% |


