Henderson SnackAbility
Overall SnackAbility
Crime in Henderson summary. We use data from the FBI to determine the crime rates in Henderson. Key points include:
There were 428 total crimes in Henderson in the last reporting year.
The overall crime rate per 100,000 people in Henderson is 3,163.1 / 100k people.
The violent crime rate per 100,000 people in Henderson is 495.2 / 100k people.
The property crime rate per 100,000 people in Henderson is 2,667.9 / 100k people.
Overall, crime in Henderson is 49.26% above the national average.
Total Crimes
Above National Average
Crime In Henderson Comparison Table
| Statistic | Count Raw |
Henderson / 100k People |
Texas / 100k People |
National / 100k People |
|---|---|---|---|---|
| Total Crimes Per 100K | 428 | 3,163.1 | 2,429.9 | 2,119.2 |
| Violent Crime | 67 | 495.2 | 389.4 | 359.0 |
| Murder | 1 | 7.4 | 5.2 | 5.0 |
| Robbery | 6 | 44.3 | 63.5 | 61.0 |
| Aggravated Assault | 49 | 362.1 | 270.7 | 256.0 |
| Property Crime | 361 | 2,667.9 | 2,040.5 | 1,760.0 |
| Burglary | 59 | 436.0 | 284.3 | 229.0 |
| Larceny | 280 | 2,069.3 | 1,425.6 | 1,272.0 |
| Car Theft | 22 | 162.6 | 330.7 | 259.0 |
Source: FBI Uniform Crime Reporting (2024)
Cost of living in Henderson summary. We use data on the cost of living to determine how expensive it is to live in Henderson. Real estate prices drive most of the variance in cost of living around Texas. Key points include:
The cost of living in Henderson is 92 with 100 being average.
The cost of living in Henderson is 0.9x lower than the national average.
The median home value in Henderson is $204,042.
The median income in Henderson is $61,285.
Henderson's Overall Cost Of Living
Lower Than The National Average
Cost Of Living In Henderson Comparison Table
| Living Expense | Henderson | Texas | National Average |
|---|---|---|---|
| Overall | 92 | 93 | 100 |
| Services | 99 | 100 | 100 |
| Groceries | 100 | 99 | 100 |
| Health | 77 | 81 | 100 |
| Housing | 101 | 97 | 100 |
| Transportation | 105 | 103 | 100 |
| Utilities | 96 | 100 | 100 |
Source: Cost of living index, normalized to US average = 100
Henderson, TX Weather
The average high in Henderson is 76.6° and the average low is 54.0°.
There are 65.6 days of precipitation each year.
Expect an average of 48.6 inches of precipitation each year with 0.6 inches of snow.
| Stat | Henderson |
|---|---|
| Average Annual High | 76.6 |
| Average Annual Low | 54.0 |
| Annual Precipitation Days | 65.6 |
| Average Annual Precipitation | 48.6 |
| Average Annual Snowfall | 0.6 |
Average High
Days of Rain
Source: NOAA climate normals (30-year)
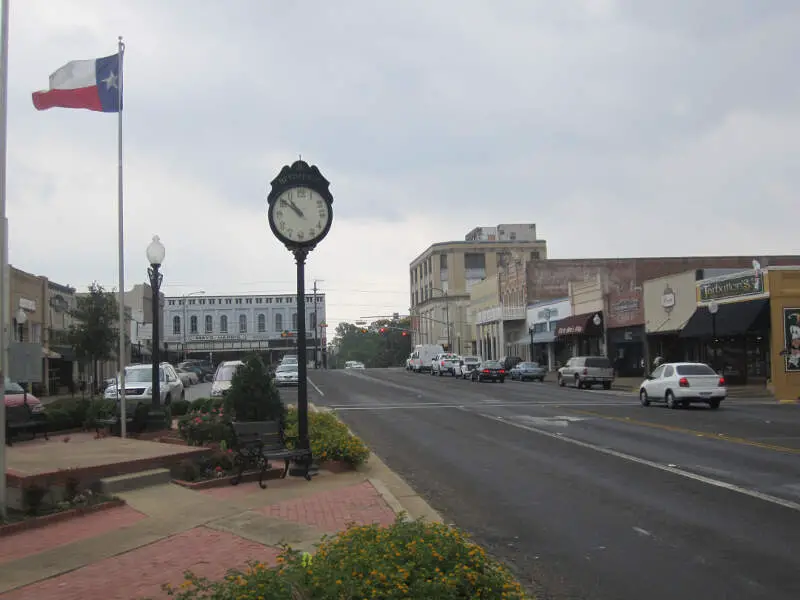
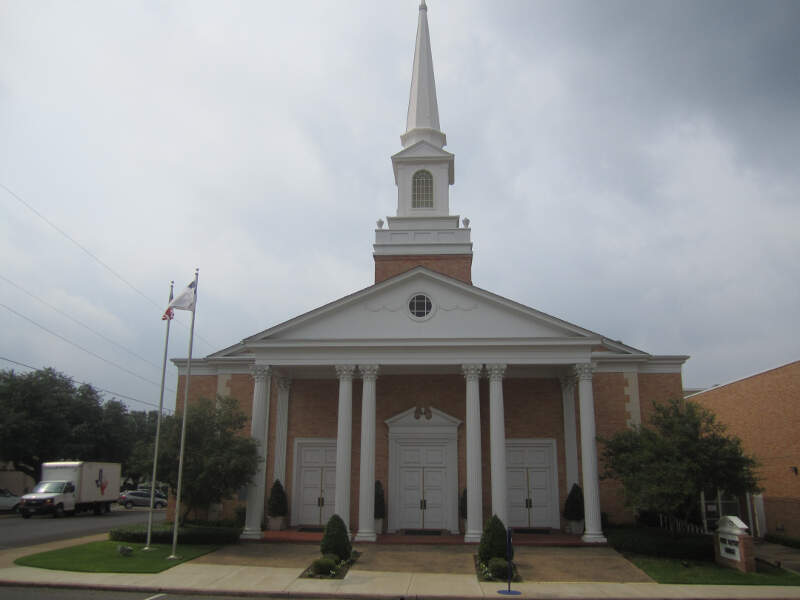
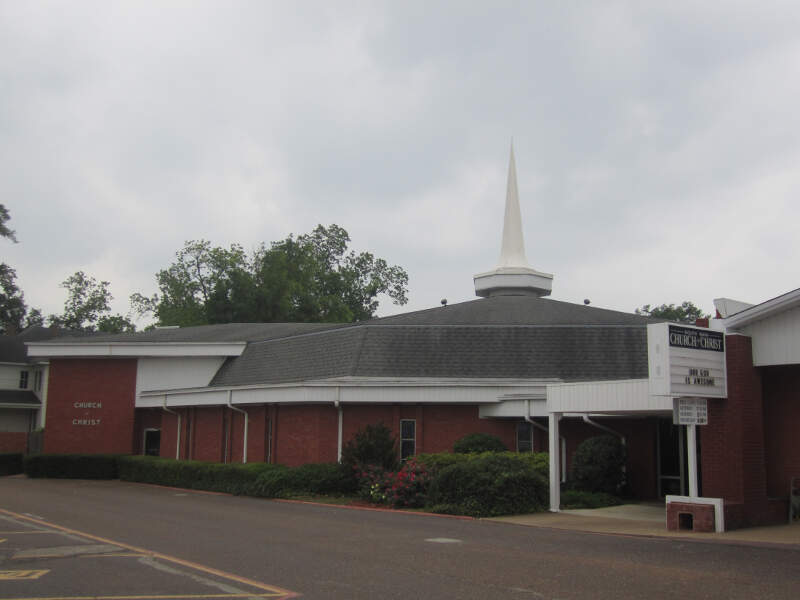
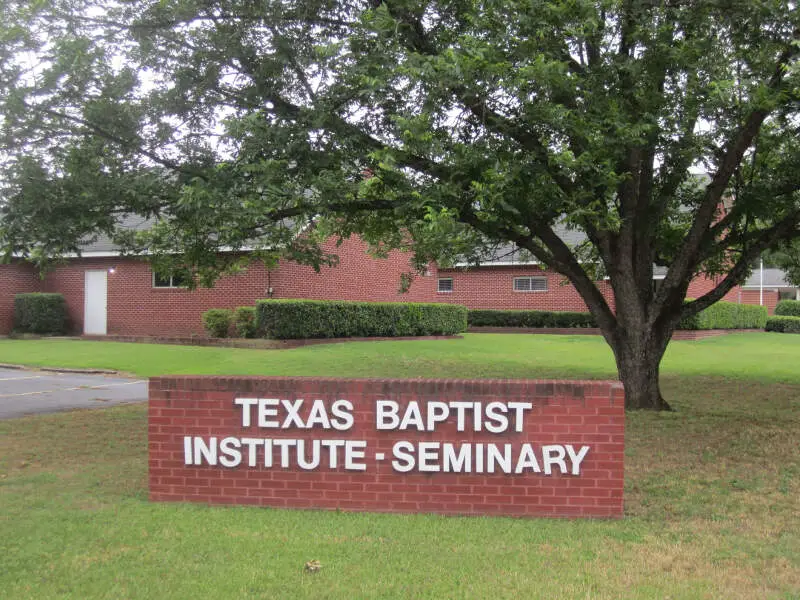
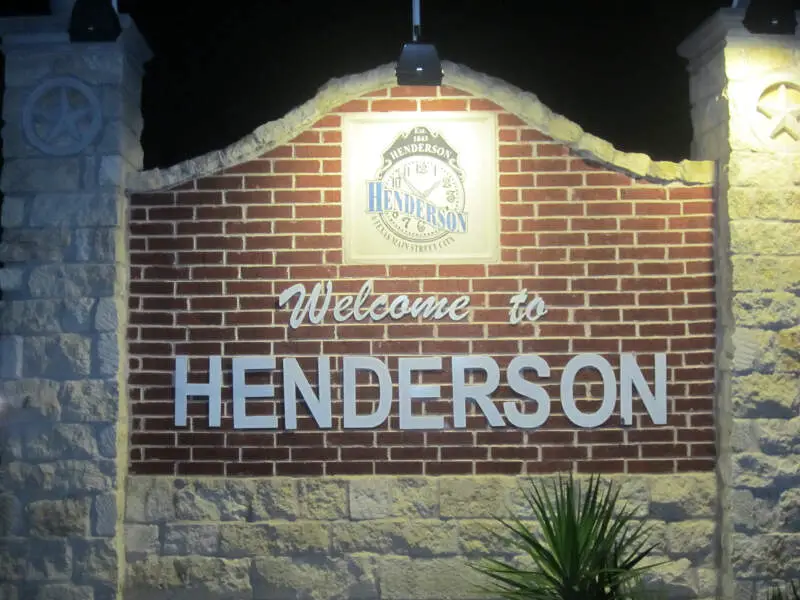
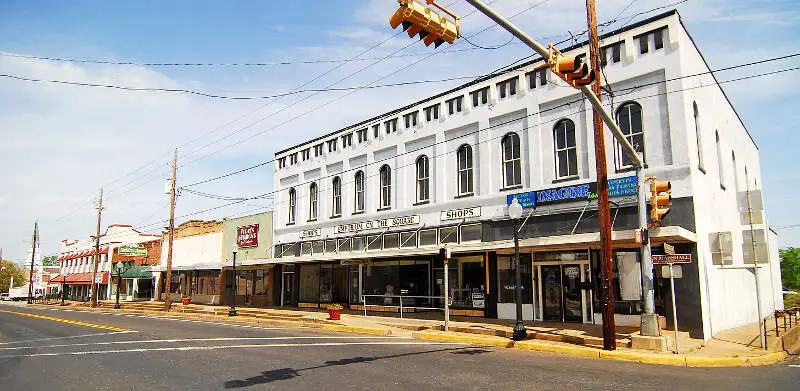
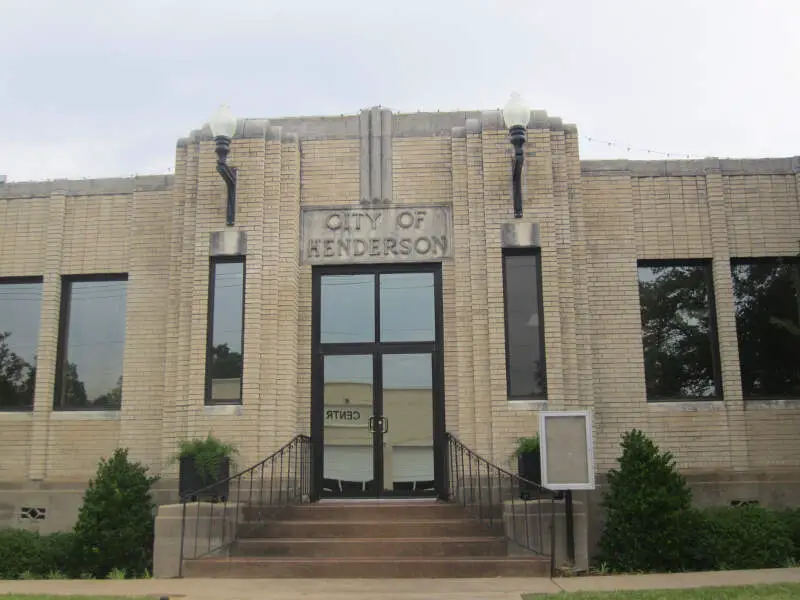
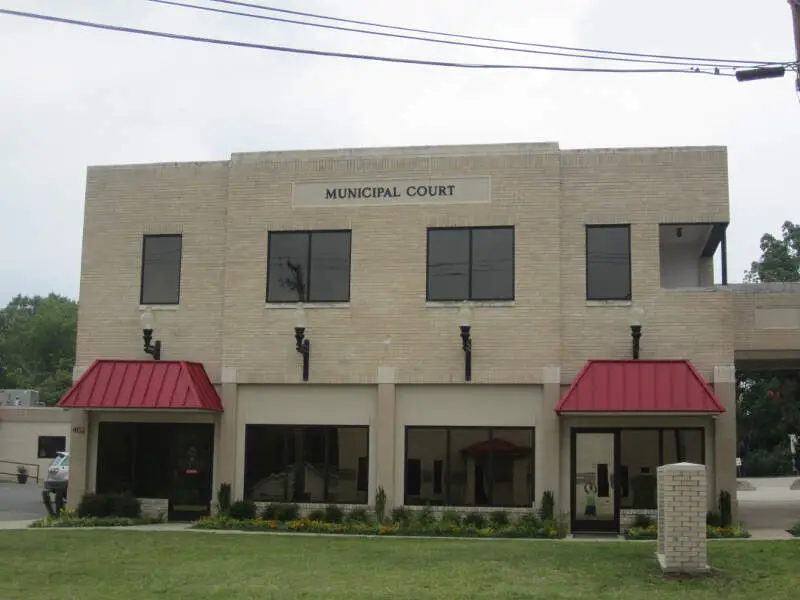
Henderson, TX Photos
Rankings & Articles For Henderson


Locations Around Henderson
Map Of Henderson, TX
Best Places Around Henderson
Kilgore, TX
Population 13,470
Longview, TX
Population 82,923
Tyler, TX
Population 109,215
Nacogdoches, TX
Population 32,197
Marshall, TX
Population 23,825
Jacksonville, TX
Population 14,325
Henderson Demographics And Statistics
Population over time in Henderson
The current population in Henderson is 13,385. The population has increased 1.3% from 2010.
| Year | Population | % Change |
|---|---|---|
| 2024 | 13,385 | 0.3% |
| 2023 | 13,348 | 0.1% |
| 2022 | 13,338 | -1.2% |
| 2021 | 13,498 | 2.7% |
| 2020 | 13,145 | -0.7% |
| 2019 | 13,237 | -0.9% |
| 2018 | 13,355 | -0.5% |
| 2017 | 13,428 | -1.2% |
| 2016 | 13,587 | -0.8% |
| 2015 | 13,695 | -0.2% |
| 2014 | 13,723 | 0.1% |
| 2013 | 13,715 | 0.7% |
| 2012 | 13,614 | 1.2% |
| 2011 | 13,455 | 1.8% |
| 2010 | 13,213 | - |
Race / Ethnicity in Henderson
See the full breakdown
Henderson is:
57.1% White with 7,643 White residents.
18.9% African American with 2,533 African American residents.
0.0% American Indian with 2 American Indian residents.
0.6% Asian with 75 Asian residents.
0.0% Hawaiian with 0 Hawaiian residents.
0.0% Other with 0 Other residents.
4.8% Two Or More with 638 Two Or More residents.
18.6% Hispanic with 2,494 Hispanic residents.
| Race | Henderson | TX | USA |
|---|---|---|---|
| White | 57.1% | 39.1% | 57.4% |
| African American | 18.9% | 11.9% | 11.9% |
| American Indian | 0.0% | 0.1% | 0.5% |
| Asian | 0.6% | 5.5% | 5.9% |
| Hawaiian | 0.0% | 0.1% | 0.2% |
| Other | 0.0% | 0.4% | 0.6% |
| Two Or More | 4.8% | 3.1% | 4.3% |
| Hispanic | 18.6% | 39.7% | 19.3% |
Gender in Henderson
See the full breakdown
Henderson is 44.7% female with 5,983 female residents.
Henderson is 55.3% male with 7,401 male residents.
| Gender | Henderson | TX | USA |
|---|---|---|---|
| Female | 44.7% | 50.1% | 50.5% |
| Male | 55.3% | 49.9% | 49.5% |
Highest level of educational attainment in Henderson for adults over 25
See the full breakdown
6.0% of adults in Henderson completed < 9th grade.
10.0% of adults in Henderson completed 9-12th grade.
31.0% of adults in Henderson completed high school / ged.
23.0% of adults in Henderson completed some college.
9.0% of adults in Henderson completed associate's degree.
12.0% of adults in Henderson completed bachelor's degree.
8.0% of adults in Henderson completed master's degree.
0.0% of adults in Henderson completed professional degree.
1.0% of adults in Henderson completed doctorate degree.
| Education | Henderson | TX | USA |
|---|---|---|---|
| < 9th Grade | 6.0% | 8.0% | 4.0% |
| 9-12th Grade | 10.0% | 7.0% | 6.0% |
| High School / GED | 31.0% | 24.0% | 26.0% |
| Some College | 23.0% | 20.0% | 19.0% |
| Associate's Degree | 9.0% | 8.0% | 9.0% |
| Bachelor's Degree | 12.0% | 21.0% | 22.0% |
| Master's Degree | 8.0% | 9.0% | 10.0% |
| Professional Degree | 0.0% | 2.0% | 2.0% |
| Doctorate Degree | 1.0% | 1.0% | 2.0% |
Household Income For Henderson, Texas
See the full breakdown
3.1% of households in Henderson earn Less than $10,000.
4.4% of households in Henderson earn $10,000 to $14,999.
5.9% of households in Henderson earn $15,000 to $24,999.
8.8% of households in Henderson earn $25,000 to $34,999.
19.4% of households in Henderson earn $35,000 to $49,999.
16.8% of households in Henderson earn $50,000 to $74,999.
10.5% of households in Henderson earn $75,000 to $99,999.
17.0% of households in Henderson earn $100,000 to $149,999.
11.5% of households in Henderson earn $150,000 to $199,999.
2.6% of households in Henderson earn $200,000 or more.
| Income | Henderson | TX | USA |
|---|---|---|---|
| Less than $10,000 | 3.1% | 5.0% | 5.0% |
| $10,000 to $14,999 | 4.4% | 3.3% | 3.4% |
| $15,000 to $24,999 | 5.9% | 6.3% | 6.3% |
| $25,000 to $34,999 | 8.8% | 6.8% | 6.6% |
| $35,000 to $49,999 | 19.4% | 10.5% | 10.1% |
| $50,000 to $74,999 | 16.8% | 16.1% | 15.5% |
| $75,000 to $99,999 | 10.5% | 12.8% | 12.6% |
| $100,000 to $149,999 | 17.0% | 17.3% | 17.5% |
| $150,000 to $199,999 | 11.5% | 9.5% | 9.6% |
| $200,000 or more | 2.6% | 12.5% | 13.4% |
Source: U.S. Census ACS 5-year estimates (2024)


