Kyle SnackAbility
Overall SnackAbility
Crime in Kyle summary. We use data from the FBI to determine the crime rates in Kyle. Key points include:
There were 706 total crimes in Kyle in the last reporting year.
The overall crime rate per 100,000 people in Kyle is 1,022.2 / 100k people.
The violent crime rate per 100,000 people in Kyle is 198.4 / 100k people.
The property crime rate per 100,000 people in Kyle is 823.8 / 100k people.
Overall, crime in Kyle is -51.77% below the national average.
Total Crimes
Below National Average
Crime In Kyle Comparison Table
| Statistic | Count Raw |
Kyle / 100k People |
Texas / 100k People |
National / 100k People |
|---|---|---|---|---|
| Total Crimes Per 100K | 706 | 1,022.2 | 2,429.9 | 2,119.2 |
| Violent Crime | 137 | 198.4 | 389.4 | 359.0 |
| Murder | 1 | 1.4 | 5.2 | 5.0 |
| Robbery | 13 | 18.8 | 63.5 | 61.0 |
| Aggravated Assault | 99 | 143.3 | 270.7 | 256.0 |
| Property Crime | 569 | 823.8 | 2,040.5 | 1,760.0 |
| Burglary | 64 | 92.7 | 284.3 | 229.0 |
| Larceny | 457 | 661.7 | 1,425.6 | 1,272.0 |
| Car Theft | 48 | 69.5 | 330.7 | 259.0 |
Source: FBI Uniform Crime Reporting (2024)
Cost of living in Kyle summary. We use data on the cost of living to determine how expensive it is to live in Kyle. Real estate prices drive most of the variance in cost of living around Texas. Key points include:
The cost of living in Kyle is 108 with 100 being average.
The cost of living in Kyle is 1.1x higher than the national average.
The median home value in Kyle is $299,795.
The median income in Kyle is $90,323.
Kyle's Overall Cost Of Living
Higher Than The National Average
Cost Of Living In Kyle Comparison Table
| Living Expense | Kyle | Texas | National Average |
|---|---|---|---|
| Overall | 108 | 93 | 100 |
| Services | 99 | 100 | 100 |
| Groceries | 99 | 99 | 100 |
| Health | 131 | 81 | 100 |
| Housing | 100 | 97 | 100 |
| Transportation | 98 | 103 | 100 |
| Utilities | 96 | 100 | 100 |
Source: Cost of living index, normalized to US average = 100
Kyle, TX Weather
The average high in Kyle is 79.6° and the average low is 56.8°.
There are 50.2 days of precipitation each year.
Expect an average of 34.6 inches of precipitation each year with 0.2 inches of snow.
| Stat | Kyle |
|---|---|
| Average Annual High | 79.6 |
| Average Annual Low | 56.8 |
| Annual Precipitation Days | 50.2 |
| Average Annual Precipitation | 34.6 |
| Average Annual Snowfall | 0.2 |
Average High
Days of Rain
Source: NOAA climate normals (30-year)
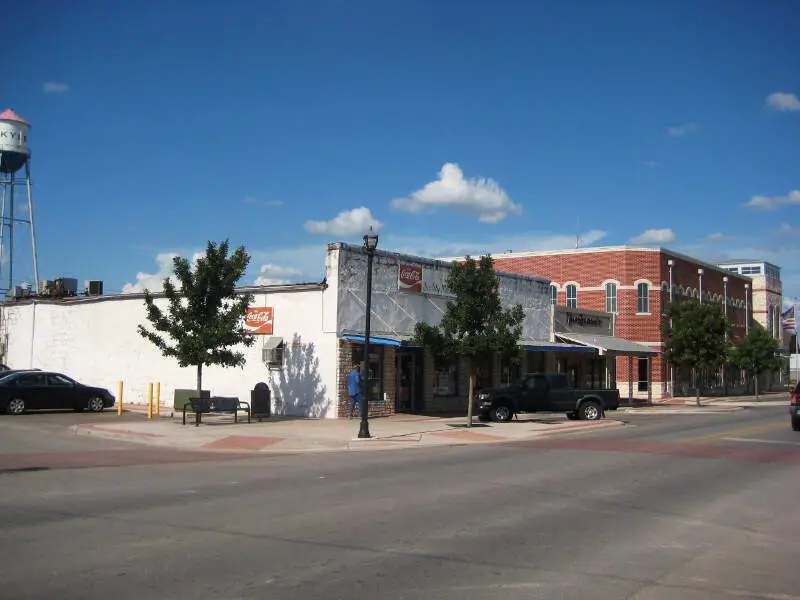
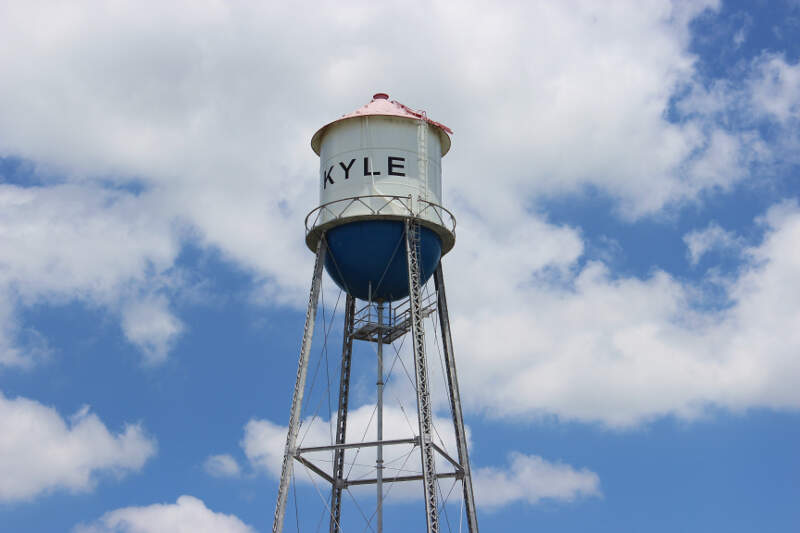
Kyle, TX Photos


Rankings & Articles For Kyle


Locations Around Kyle
Map Of Kyle, TX
Best Places Around Kyle
Brushy Creek, TX
Population 19,576
Cedar Park, TX
Population 78,301
Round Rock, TX
Population 127,786
Pflugerville, TX
Population 65,971
Hutto, TX
Population 35,483
Cibolo, TX
Population 35,109
Converse, TX
Population 29,607
Leander, TX
Population 74,067
Georgetown, TX
Population 85,999
Timberwood Park, TX
Population 35,413
Kyle Demographics And Statistics
Population over time in Kyle
The current population in Kyle is 56,823. The population has increased 136.2% from 2010.
| Year | Population | % Change |
|---|---|---|
| 2024 | 56,823 | 8.4% |
| 2023 | 52,439 | 8.2% |
| 2022 | 48,484 | 7.4% |
| 2021 | 45,147 | -1.5% |
| 2020 | 45,828 | 7.3% |
| 2019 | 42,706 | 7.1% |
| 2018 | 39,857 | 7.9% |
| 2017 | 36,929 | 8.4% |
| 2016 | 34,080 | 6.2% |
| 2015 | 32,078 | 4.6% |
| 2014 | 30,664 | 4.3% |
| 2013 | 29,396 | 5.4% |
| 2012 | 27,886 | 7.0% |
| 2011 | 26,054 | 8.3% |
| 2010 | 24,062 | - |
Race / Ethnicity in Kyle
See the full breakdown
Kyle is:
38.9% White with 22,111 White residents.
4.5% African American with 2,554 African American residents.
0.0% American Indian with 25 American Indian residents.
1.0% Asian with 581 Asian residents.
0.0% Hawaiian with 0 Hawaiian residents.
0.6% Other with 317 Other residents.
3.1% Two Or More with 1,776 Two Or More residents.
51.8% Hispanic with 29,459 Hispanic residents.
| Race | Kyle | TX | USA |
|---|---|---|---|
| White | 38.9% | 39.1% | 57.4% |
| African American | 4.5% | 11.9% | 11.9% |
| American Indian | 0.0% | 0.1% | 0.5% |
| Asian | 1.0% | 5.5% | 5.9% |
| Hawaiian | 0.0% | 0.1% | 0.2% |
| Other | 0.6% | 0.4% | 0.6% |
| Two Or More | 3.1% | 3.1% | 4.3% |
| Hispanic | 51.8% | 39.7% | 19.3% |
Gender in Kyle
See the full breakdown
Kyle is 49.7% female with 28,222 female residents.
Kyle is 50.3% male with 28,601 male residents.
| Gender | Kyle | TX | USA |
|---|---|---|---|
| Female | 49.7% | 50.1% | 50.5% |
| Male | 50.3% | 49.9% | 49.5% |
Highest level of educational attainment in Kyle for adults over 25
See the full breakdown
5.0% of adults in Kyle completed < 9th grade.
4.0% of adults in Kyle completed 9-12th grade.
25.0% of adults in Kyle completed high school / ged.
25.0% of adults in Kyle completed some college.
10.0% of adults in Kyle completed associate's degree.
21.0% of adults in Kyle completed bachelor's degree.
8.0% of adults in Kyle completed master's degree.
1.0% of adults in Kyle completed professional degree.
1.0% of adults in Kyle completed doctorate degree.
| Education | Kyle | TX | USA |
|---|---|---|---|
| < 9th Grade | 5.0% | 8.0% | 4.0% |
| 9-12th Grade | 4.0% | 7.0% | 6.0% |
| High School / GED | 25.0% | 24.0% | 26.0% |
| Some College | 25.0% | 20.0% | 19.0% |
| Associate's Degree | 10.0% | 8.0% | 9.0% |
| Bachelor's Degree | 21.0% | 21.0% | 22.0% |
| Master's Degree | 8.0% | 9.0% | 10.0% |
| Professional Degree | 1.0% | 2.0% | 2.0% |
| Doctorate Degree | 1.0% | 1.0% | 2.0% |
Household Income For Kyle, Texas
See the full breakdown
3.8% of households in Kyle earn Less than $10,000.
0.4% of households in Kyle earn $10,000 to $14,999.
2.5% of households in Kyle earn $15,000 to $24,999.
7.1% of households in Kyle earn $25,000 to $34,999.
9.7% of households in Kyle earn $35,000 to $49,999.
12.8% of households in Kyle earn $50,000 to $74,999.
21.2% of households in Kyle earn $75,000 to $99,999.
23.5% of households in Kyle earn $100,000 to $149,999.
10.8% of households in Kyle earn $150,000 to $199,999.
8.1% of households in Kyle earn $200,000 or more.
| Income | Kyle | TX | USA |
|---|---|---|---|
| Less than $10,000 | 3.8% | 5.0% | 5.0% |
| $10,000 to $14,999 | 0.4% | 3.3% | 3.4% |
| $15,000 to $24,999 | 2.5% | 6.3% | 6.3% |
| $25,000 to $34,999 | 7.1% | 6.8% | 6.6% |
| $35,000 to $49,999 | 9.7% | 10.5% | 10.1% |
| $50,000 to $74,999 | 12.8% | 16.1% | 15.5% |
| $75,000 to $99,999 | 21.2% | 12.8% | 12.6% |
| $100,000 to $149,999 | 23.5% | 17.3% | 17.5% |
| $150,000 to $199,999 | 10.8% | 9.5% | 9.6% |
| $200,000 or more | 8.1% | 12.5% | 13.4% |
Source: U.S. Census ACS 5-year estimates (2024)


