Compare Lubbock to…
Lubbock SnackAbility
Overall SnackAbility
Crime in Lubbock summary. We use data from the FBI to determine the crime rates in Lubbock. Key points include:
There were 9,311 total crimes in Lubbock in the last reporting year.
The overall crime rate per 100,000 people in Lubbock is 3,449.8 / 100k people.
The violent crime rate per 100,000 people in Lubbock is 821.0 / 100k people.
The property crime rate per 100,000 people in Lubbock is 2,628.8 / 100k people.
Overall, crime in Lubbock is 62.79% above the national average.
Total Crimes
Above National Average
Crime In Lubbock Comparison Table
| Statistic | Count Raw |
Lubbock / 100k People |
Texas / 100k People |
National / 100k People |
|---|---|---|---|---|
| Total Crimes Per 100K | 9,311 | 3,449.8 | 2,429.9 | 2,119.2 |
| Violent Crime | 2,216 | 821.0 | 389.4 | 359.0 |
| Murder | 14 | 5.2 | 5.2 | 5.0 |
| Robbery | 312 | 115.6 | 63.5 | 61.0 |
| Aggravated Assault | 1,682 | 623.2 | 270.7 | 256.0 |
| Property Crime | 7,095 | 2,628.8 | 2,040.5 | 1,760.0 |
| Burglary | 1,452 | 538.0 | 284.3 | 229.0 |
| Larceny | 4,920 | 1,822.9 | 1,425.6 | 1,272.0 |
| Car Theft | 723 | 267.9 | 330.7 | 259.0 |
Source: FBI Uniform Crime Reporting (2024)
Cost of living in Lubbock summary. We use data on the cost of living to determine how expensive it is to live in Lubbock. Real estate prices drive most of the variance in cost of living around Texas. Key points include:
The cost of living in Lubbock is 97 with 100 being average.
The cost of living in Lubbock is 1.0x lower than the national average.
The median home value in Lubbock is $209,436.
The median income in Lubbock is $60,895.
Lubbock's Overall Cost Of Living
Lower Than The National Average
Cost Of Living In Lubbock Comparison Table
| Living Expense | Lubbock | Texas | National Average |
|---|---|---|---|
| Overall | 97 | 93 | 100 |
| Services | 95 | 100 | 100 |
| Groceries | 95 | 99 | 100 |
| Health | 90 | 81 | 100 |
| Housing | 104 | 97 | 100 |
| Transportation | 102 | 103 | 100 |
| Utilities | 96 | 100 | 100 |
Source: Cost of living index, normalized to US average = 100
Lubbock, TX Weather
The average high in Lubbock is 74.0° and the average low is 46.4°.
There are 35.3 days of precipitation each year.
Expect an average of 19.7 inches of precipitation each year with 7.4 inches of snow.
| Stat | Lubbock |
|---|---|
| Average Annual High | 74.0 |
| Average Annual Low | 46.4 |
| Annual Precipitation Days | 35.3 |
| Average Annual Precipitation | 19.7 |
| Average Annual Snowfall | 7.4 |
Average High
Days of Rain
Source: NOAA climate normals (30-year)
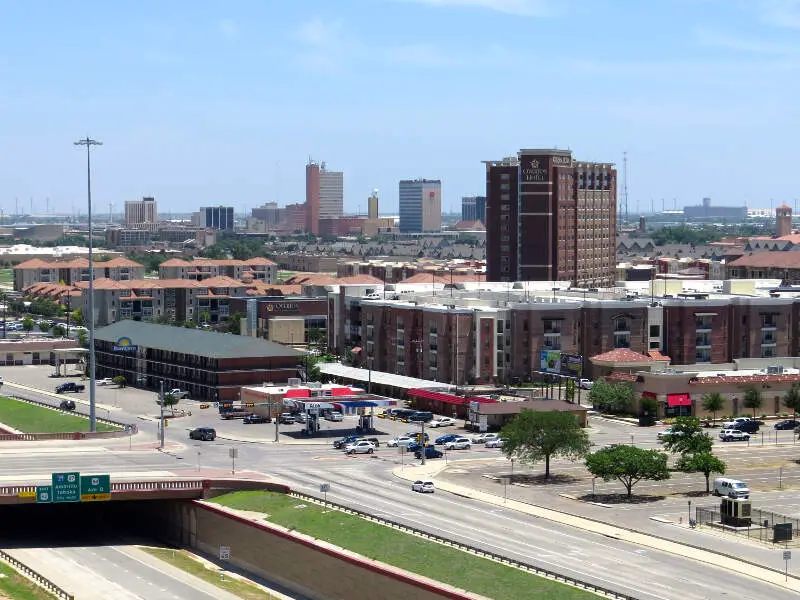
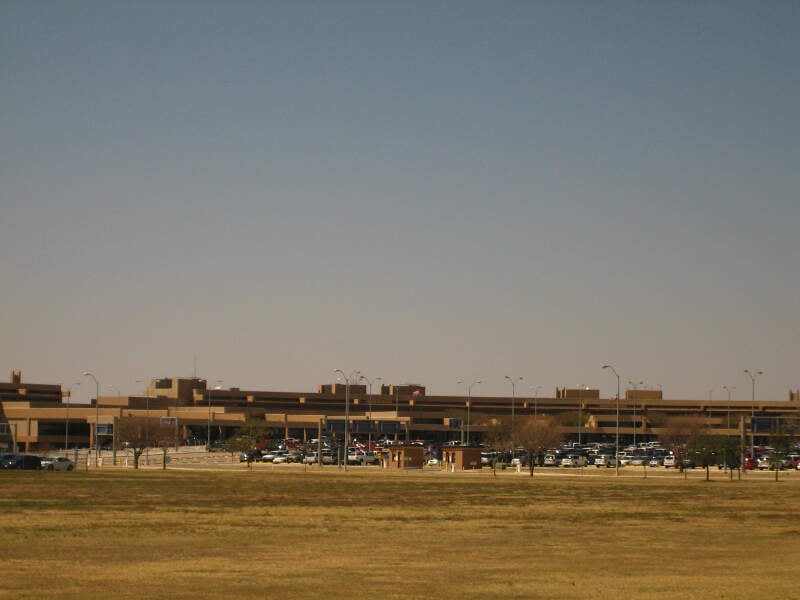
Lubbock, TX Photos


3 Reviews & Comments About Lubbock

I like Lubbock in general growing up thirty minutes away. I live here now and it is a lot better and building alot of businesses and housing. The crime is getting really scary and bad here.
Their is a lot of places to eat out at. A lot of people are also moving here at a fast rate and so much construction as well.
Lubbock Texas is a small West Texas city that is flat and dusty. The university Texas Tech is there along with a large medical center. There is the depot district in downtown Lubbock that hosts many bars and places to eat. Lubbock is a large cotton growing region.
The good about Lubbock is it is one of the most friendly places is America. Everybody loves to talk and wave on a lonesome road. The bad is there is a very limited amount of activities and fun things to do in this city.
There is nothing to do in Lubbock except get drunk. College students turn into actual alcoholics because there is no remotely fun activities.
You have to stay indoors when there is a dust storm. I was once caught outside in a dust storm, and I literally couldn't see one foot ahead of me. I had dust in my hair for days. I wanted to die.
Rankings & Articles For Lubbock


Locations Around Lubbock
Map Of Lubbock, TX
Lubbock Demographics And Statistics
Population over time in Lubbock
The current population in Lubbock is 264,814. The population has increased 19.1% from 2010.
| Year | Population | % Change |
|---|---|---|
| 2024 | 264,814 | 1.4% |
| 2023 | 261,078 | 1.1% |
| 2022 | 258,190 | 1.0% |
| 2021 | 255,537 | -0.6% |
| 2020 | 257,013 | 1.2% |
| 2019 | 253,851 | 1.4% |
| 2018 | 250,415 | 1.3% |
| 2017 | 247,323 | 1.2% |
| 2016 | 244,507 | 1.6% |
| 2015 | 240,719 | 1.6% |
| 2014 | 236,868 | 1.6% |
| 2013 | 233,162 | 1.6% |
| 2012 | 229,428 | 1.6% |
| 2011 | 225,883 | 1.6% |
| 2010 | 222,272 | - |
Race / Ethnicity in Lubbock
See the full breakdown
Lubbock is:
49.6% White with 131,395 White residents.
7.7% African American with 20,386 African American residents.
0.1% American Indian with 353 American Indian residents.
2.7% Asian with 7,170 Asian residents.
0.1% Hawaiian with 221 Hawaiian residents.
0.3% Other with 796 Other residents.
2.8% Two Or More with 7,454 Two Or More residents.
36.6% Hispanic with 97,039 Hispanic residents.
| Race | Lubbock | TX | USA |
|---|---|---|---|
| White | 49.6% | 39.1% | 57.4% |
| African American | 7.7% | 11.9% | 11.9% |
| American Indian | 0.1% | 0.1% | 0.5% |
| Asian | 2.7% | 5.5% | 5.9% |
| Hawaiian | 0.1% | 0.1% | 0.2% |
| Other | 0.3% | 0.4% | 0.6% |
| Two Or More | 2.8% | 3.1% | 4.3% |
| Hispanic | 36.6% | 39.7% | 19.3% |
Gender in Lubbock
See the full breakdown
Lubbock is 51.0% female with 134,935 female residents.
Lubbock is 49.0% male with 129,879 male residents.
| Gender | Lubbock | TX | USA |
|---|---|---|---|
| Female | 51.0% | 50.1% | 50.5% |
| Male | 49.0% | 49.9% | 49.5% |
Highest level of educational attainment in Lubbock for adults over 25
See the full breakdown
3.0% of adults in Lubbock completed < 9th grade.
7.0% of adults in Lubbock completed 9-12th grade.
25.0% of adults in Lubbock completed high school / ged.
22.0% of adults in Lubbock completed some college.
8.0% of adults in Lubbock completed associate's degree.
21.0% of adults in Lubbock completed bachelor's degree.
9.0% of adults in Lubbock completed master's degree.
2.0% of adults in Lubbock completed professional degree.
3.0% of adults in Lubbock completed doctorate degree.
| Education | Lubbock | TX | USA |
|---|---|---|---|
| < 9th Grade | 3.0% | 8.0% | 4.0% |
| 9-12th Grade | 7.0% | 7.0% | 6.0% |
| High School / GED | 25.0% | 24.0% | 26.0% |
| Some College | 22.0% | 20.0% | 19.0% |
| Associate's Degree | 8.0% | 8.0% | 9.0% |
| Bachelor's Degree | 21.0% | 21.0% | 22.0% |
| Master's Degree | 9.0% | 9.0% | 10.0% |
| Professional Degree | 2.0% | 2.0% | 2.0% |
| Doctorate Degree | 3.0% | 1.0% | 2.0% |
Household Income For Lubbock, Texas
See the full breakdown
7.7% of households in Lubbock earn Less than $10,000.
4.4% of households in Lubbock earn $10,000 to $14,999.
8.6% of households in Lubbock earn $15,000 to $24,999.
8.9% of households in Lubbock earn $25,000 to $34,999.
12.5% of households in Lubbock earn $35,000 to $49,999.
16.3% of households in Lubbock earn $50,000 to $74,999.
12.5% of households in Lubbock earn $75,000 to $99,999.
15.3% of households in Lubbock earn $100,000 to $149,999.
6.3% of households in Lubbock earn $150,000 to $199,999.
7.5% of households in Lubbock earn $200,000 or more.
| Income | Lubbock | TX | USA |
|---|---|---|---|
| Less than $10,000 | 7.7% | 5.0% | 5.0% |
| $10,000 to $14,999 | 4.4% | 3.3% | 3.4% |
| $15,000 to $24,999 | 8.6% | 6.3% | 6.3% |
| $25,000 to $34,999 | 8.9% | 6.8% | 6.6% |
| $35,000 to $49,999 | 12.5% | 10.5% | 10.1% |
| $50,000 to $74,999 | 16.3% | 16.1% | 15.5% |
| $75,000 to $99,999 | 12.5% | 12.8% | 12.6% |
| $100,000 to $149,999 | 15.3% | 17.3% | 17.5% |
| $150,000 to $199,999 | 6.3% | 9.5% | 9.6% |
| $200,000 or more | 7.5% | 12.5% | 13.4% |
Source: U.S. Census ACS 5-year estimates (2024)


