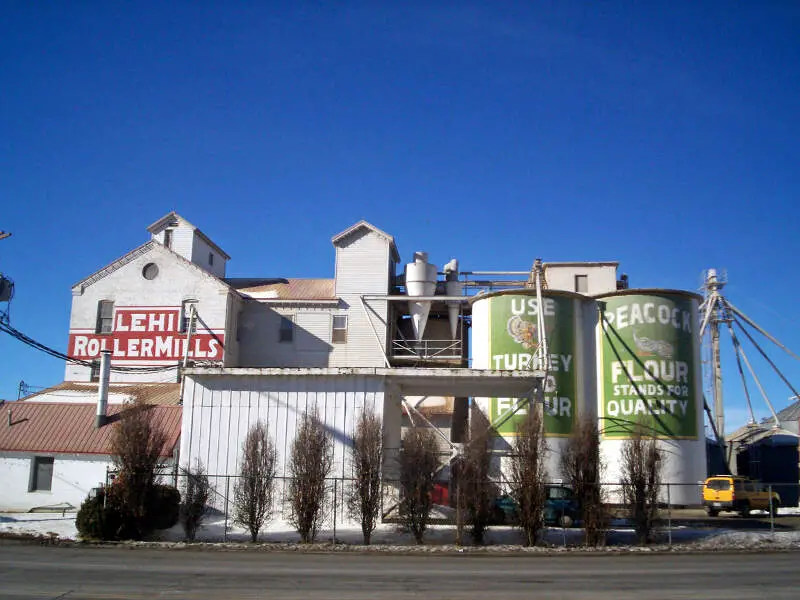
Lehi, UT
Demographics And Statistics
Living In Lehi, Utah Summary
Life in Lehi research summary. HomeSnacks has been using Saturday Night Science to research the quality of life in Lehi over the past nine years using Census, FBI, Zillow, and other primary data sources. Based on the most recently available data, we found the following about life in Lehi:
The population in Lehi is 81,039.
The median home value in Lehi is $561,692.
The median income in Lehi is $125,860.
The cost of living in Lehi is 127 which is 1.3x higher than the national average.
The median rent in Lehi is $1,798.
The unemployment rate in Lehi is 4.1%.
The poverty rate in Lehi is 4.8%.
The average high in Lehi is 64.4° and the average low is 38.8°.
Table Of Contents
Lehi SnackAbility
Overall SnackAbility
Lehi, UT Cost Of Living
Cost of living in Lehi summary. We use data on the cost of living to determine how expensive it is to live in Lehi. Real estate prices drive most of the variance in cost of living around Utah. Key points include:
The cost of living in Lehi is 127 with 100 being average.
The cost of living in Lehi is 1.3x higher than the national average.
The median home value in Lehi is $561,692.
The median income in Lehi is $125,860.
Lehi's Overall Cost Of Living
Higher Than The National Average
Cost Of Living In Lehi Comparison Table
| Living Expense | Lehi | Utah | National Average | |
|---|---|---|---|---|
| Overall | 127 | 104 | 100 | |
| Services | 101 | 101 | 100 | |
| Groceries | 97 | 98 | 100 | |
| Health | 96 | 90 | 100 | |
| Housing | 192 | 115 | 100 | |
| Transportation | 108 | 104 | 100 | |
| Utilities | 90 | 96 | 100 | |
Lehi, UT Weather
The average high in Lehi is 64.4° and the average low is 38.8°.
There are 42.1 days of precipitation each year.
Expect an average of 15.1 inches of precipitation each year with 44.2 inches of snow.
| Stat | Lehi |
|---|---|
| Average Annual High | 64.4 |
| Average Annual Low | 38.8 |
| Annual Precipitation Days | 42.1 |
| Average Annual Precipitation | 15.1 |
| Average Annual Snowfall | 44.2 |
Average High
Days of Rain
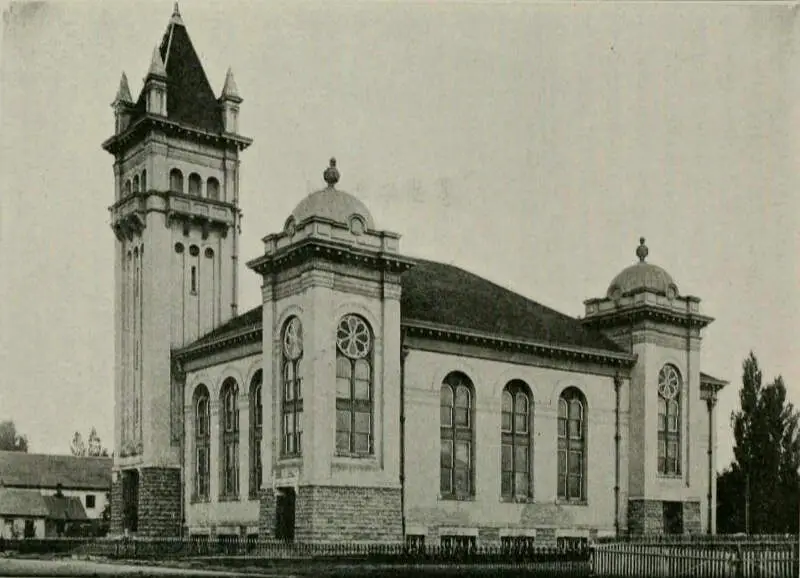
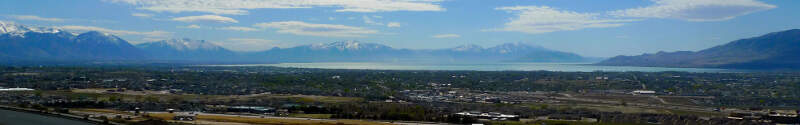
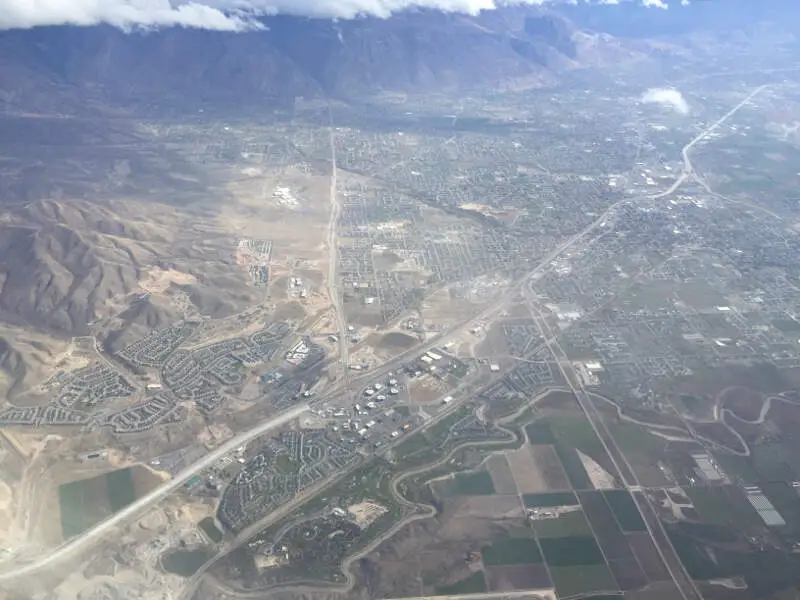
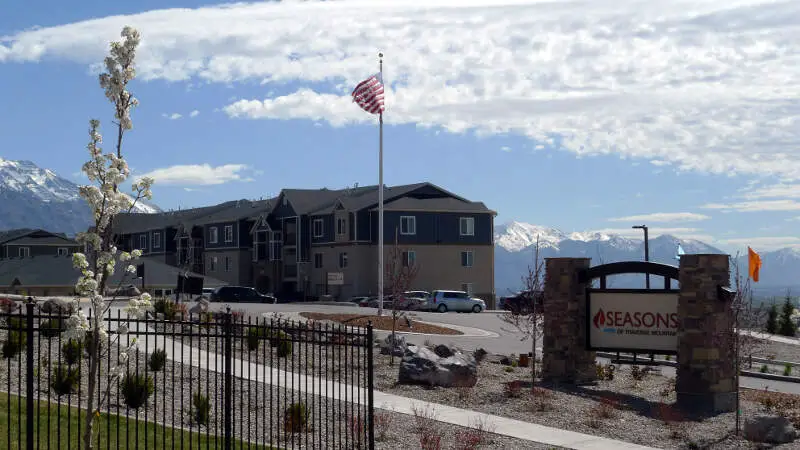
Lehi, UT Photos


Rankings for Lehi in Utah


Locations Around Lehi
Map Of Lehi, UT
Best Places Around Lehi
South Jordan, UT
Population 80,331
Cedar Hills, UT
Population 9,945
Riverton, UT
Population 44,944
Highland, UT
Population 19,625
Cottonwood Heights, UT
Population 32,984
Draper, UT
Population 50,159
Holladay, UT
Population 31,236
Sandy, UT
Population 94,723
Alpine, UT
Population 10,272
Herriman, UT
Population 57,336
Lehi Demographics And Statistics
Population over time in Lehi
The current population in Lehi is 81,039. The population has increased 92.7% from 2010.
| Year | Population | % Change |
|---|---|---|
| 2023 | 81,039 | 5.1% |
| 2022 | 77,110 | 4.3% |
| 2021 | 73,911 | 10.3% |
| 2020 | 66,980 | 4.6% |
| 2019 | 64,006 | 4.1% |
| 2018 | 61,508 | 5.4% |
| 2017 | 58,351 | 3.6% |
| 2016 | 56,314 | 4.1% |
| 2015 | 54,079 | 4.0% |
| 2014 | 51,982 | 4.4% |
| 2013 | 49,804 | 5.6% |
| 2012 | 47,180 | 5.8% |
| 2011 | 44,608 | 6.1% |
| 2010 | 42,047 | - |
Race / Ethnicity in Lehi
Lehi is:
83.6% White with 67,778 White residents.
0.5% African American with 368 African American residents.
0.2% American Indian with 142 American Indian residents.
2.1% Asian with 1,677 Asian residents.
0.6% Hawaiian with 460 Hawaiian residents.
0.2% Other with 177 Other residents.
3.6% Two Or More with 2,949 Two Or More residents.
9.2% Hispanic with 7,488 Hispanic residents.
| Race | Lehi | UT | USA |
|---|---|---|---|
| White | 83.6% | 75.7% | 58.2% |
| African American | 0.5% | 1.0% | 12.0% |
| American Indian | 0.2% | 0.7% | 0.5% |
| Asian | 2.1% | 2.3% | 5.7% |
| Hawaiian | 0.6% | 0.9% | 0.2% |
| Other | 0.2% | 0.4% | 0.5% |
| Two Or More | 3.6% | 3.6% | 3.9% |
| Hispanic | 9.2% | 15.4% | 19.0% |
Gender in Lehi
Lehi is 49.0% female with 39,718 female residents.
Lehi is 51.0% male with 41,320 male residents.
| Gender | Lehi | UT | USA |
|---|---|---|---|
| Female | 49.0% | 49.4% | 50.5% |
| Male | 51.0% | 50.6% | 49.5% |
Highest level of educational attainment in Lehi for adults over 25
1.0% of adults in Lehi completed < 9th grade.
2.0% of adults in Lehi completed 9-12th grade.
15.0% of adults in Lehi completed high school / ged.
23.0% of adults in Lehi completed some college.
9.0% of adults in Lehi completed associate's degree.
35.0% of adults in Lehi completed bachelor's degree.
12.0% of adults in Lehi completed master's degree.
2.0% of adults in Lehi completed professional degree.
1.0% of adults in Lehi completed doctorate degree.
| Education | Lehi | UT | USA |
|---|---|---|---|
| < 9th Grade | 1.0% | 3.0% | 5.0% |
| 9-12th Grade | 2.0% | 4.0% | 6.0% |
| High School / GED | 15.0% | 22.0% | 26.0% |
| Some College | 23.0% | 24.0% | 19.0% |
| Associate's Degree | 9.0% | 10.0% | 9.0% |
| Bachelor's Degree | 35.0% | 24.0% | 21.0% |
| Master's Degree | 12.0% | 9.0% | 10.0% |
| Professional Degree | 2.0% | 2.0% | 2.0% |
| Doctorate Degree | 1.0% | 2.0% | 2.0% |
Household Income For Lehi, Utah
1.6% of households in Lehi earn Less than $10,000.
0.3% of households in Lehi earn $10,000 to $14,999.
2.2% of households in Lehi earn $15,000 to $24,999.
2.8% of households in Lehi earn $25,000 to $34,999.
4.8% of households in Lehi earn $35,000 to $49,999.
12.0% of households in Lehi earn $50,000 to $74,999.
12.3% of households in Lehi earn $75,000 to $99,999.
25.3% of households in Lehi earn $100,000 to $149,999.
17.3% of households in Lehi earn $150,000 to $199,999.
21.5% of households in Lehi earn $200,000 or more.
| Income | Lehi | UT | USA |
|---|---|---|---|
| Less than $10,000 | 1.6% | 3.1% | 4.9% |
| $10,000 to $14,999 | 0.3% | 2.1% | 3.6% |
| $15,000 to $24,999 | 2.2% | 4.3% | 6.6% |
| $25,000 to $34,999 | 2.8% | 5.3% | 6.8% |
| $35,000 to $49,999 | 4.8% | 9.2% | 10.4% |
| $50,000 to $74,999 | 12.0% | 15.9% | 15.7% |
| $75,000 to $99,999 | 12.3% | 14.6% | 12.7% |
| $100,000 to $149,999 | 25.3% | 21.6% | 17.4% |
| $150,000 to $199,999 | 17.3% | 11.3% | 9.3% |
| $200,000 or more | 21.5% | 12.6% | 12.6% |


