Compare Salt Lake City to…
Salt Lake City SnackAbility
Overall SnackAbility
Crime in Salt Lake City summary. We use data from the FBI to determine the crime rates in Salt Lake City. Key points include:
There were 12,897 total crimes in Salt Lake City in the last reporting year.
The overall crime rate per 100,000 people in Salt Lake City is 6,064.2 / 100k people.
The violent crime rate per 100,000 people in Salt Lake City is 864.2 / 100k people.
The property crime rate per 100,000 people in Salt Lake City is 5,200.0 / 100k people.
Overall, crime in Salt Lake City is 186.15% above the national average.
Total Crimes
Above National Average
Crime In Salt Lake City Comparison Table
| Statistic | Count Raw |
Salt Lake City / 100k People |
Utah / 100k People |
National / 100k People |
|---|---|---|---|---|
| Total Crimes Per 100K | 12,897 | 6,064.2 | 1,638.5 | 2,119.2 |
| Violent Crime | 1,838 | 864.2 | 229.6 | 359.0 |
| Murder | 11 | 5.2 | 2.6 | 5.0 |
| Robbery | 390 | 183.4 | 27.3 | 61.0 |
| Aggravated Assault | 1,100 | 517.2 | 141.7 | 256.0 |
| Property Crime | 11,059 | 5,200.0 | 1,408.9 | 1,760.0 |
| Burglary | 1,172 | 551.1 | 146.6 | 229.0 |
| Larceny | 8,900 | 4,184.8 | 1,145.8 | 1,272.0 |
| Car Theft | 987 | 464.1 | 116.5 | 259.0 |
Source: FBI Uniform Crime Reporting (2024)
Cost of living in Salt Lake City summary. We use data on the cost of living to determine how expensive it is to live in Salt Lake City. Real estate prices drive most of the variance in cost of living around Utah. Key points include:
The cost of living in Salt Lake City is 124 with 100 being average.
The cost of living in Salt Lake City is 1.2x higher than the national average.
The median home value in Salt Lake City is $573,181.
The median income in Salt Lake City is $75,090.
Salt Lake City's Overall Cost Of Living
Higher Than The National Average
Cost Of Living In Salt Lake City Comparison Table
| Living Expense | Salt Lake City | Utah | National Average |
|---|---|---|---|
| Overall | 124 | 106 | 100 |
| Services | 102 | 100 | 100 |
| Groceries | 105 | 101 | 100 |
| Health | 162 | 111 | 100 |
| Housing | 104 | 103 | 100 |
| Transportation | 106 | 103 | 100 |
| Utilities | 112 | 103 | 100 |
Source: Cost of living index, normalized to US average = 100
Salt Lake City, UT Weather
The average high in Salt Lake City is 63.5° and the average low is 41.0°.
There are 47.2 days of precipitation each year.
Expect an average of 17.7 inches of precipitation each year with 61.1 inches of snow.
| Stat | Salt Lake City |
|---|---|
| Average Annual High | 63.5 |
| Average Annual Low | 41.0 |
| Annual Precipitation Days | 47.2 |
| Average Annual Precipitation | 17.7 |
| Average Annual Snowfall | 61.1 |
Average High
Days of Rain
Source: NOAA climate normals (30-year)
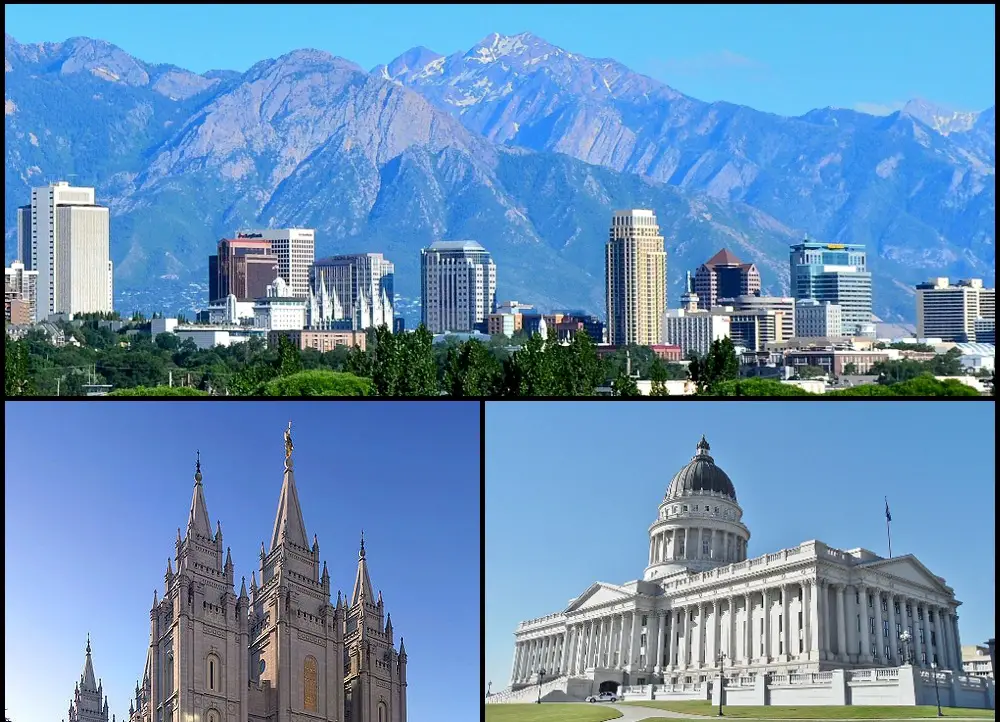
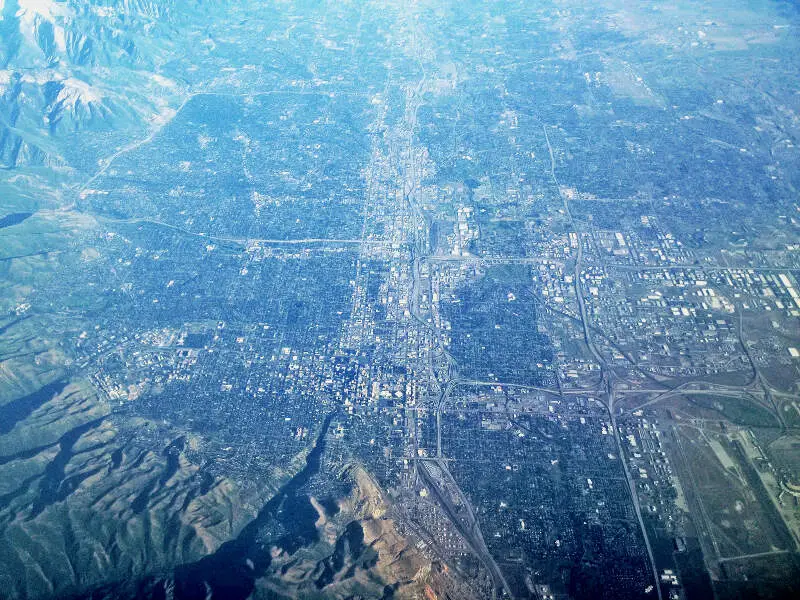
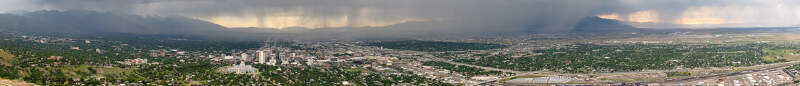
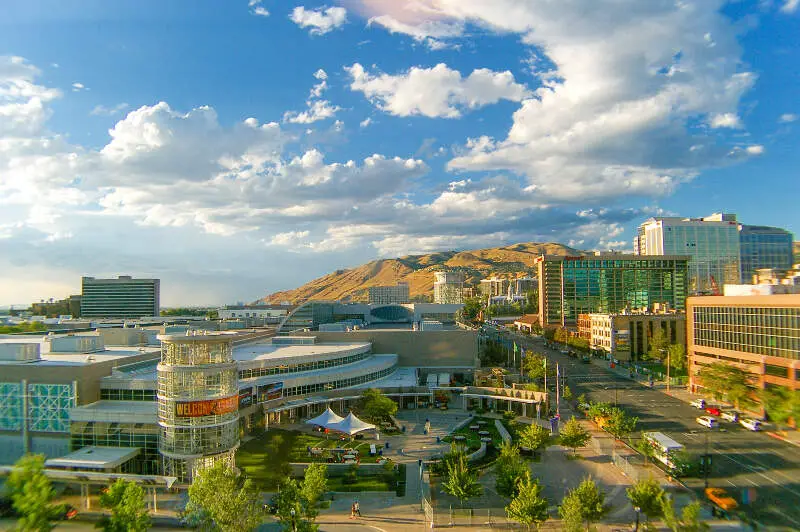
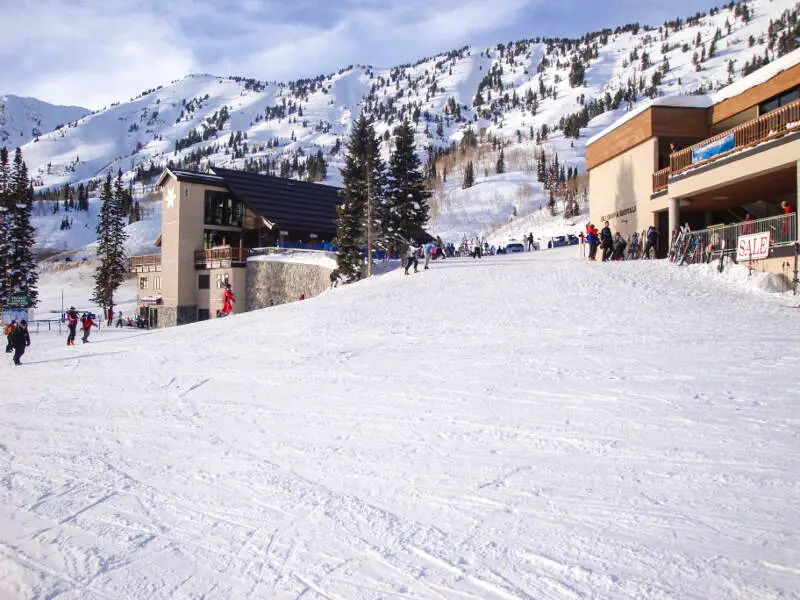
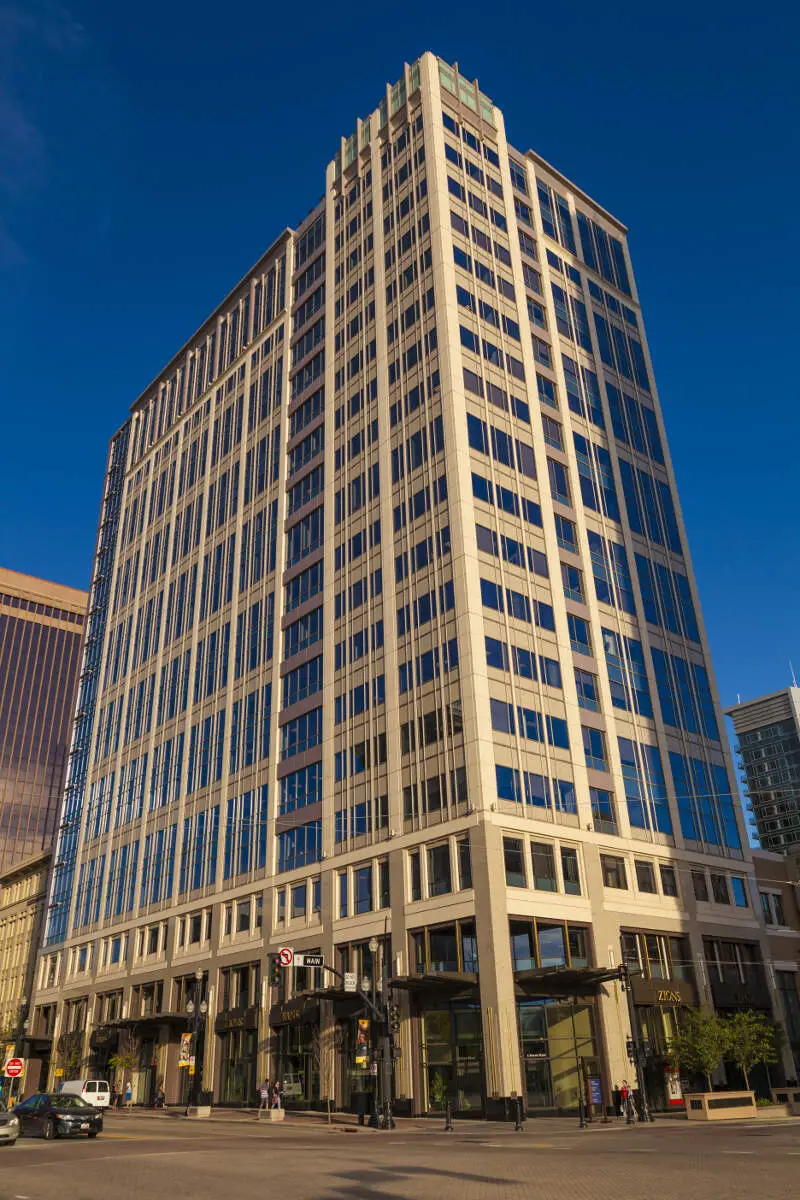
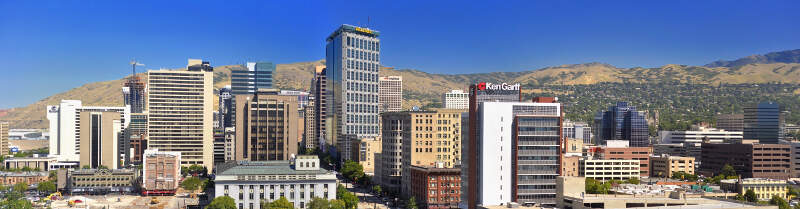
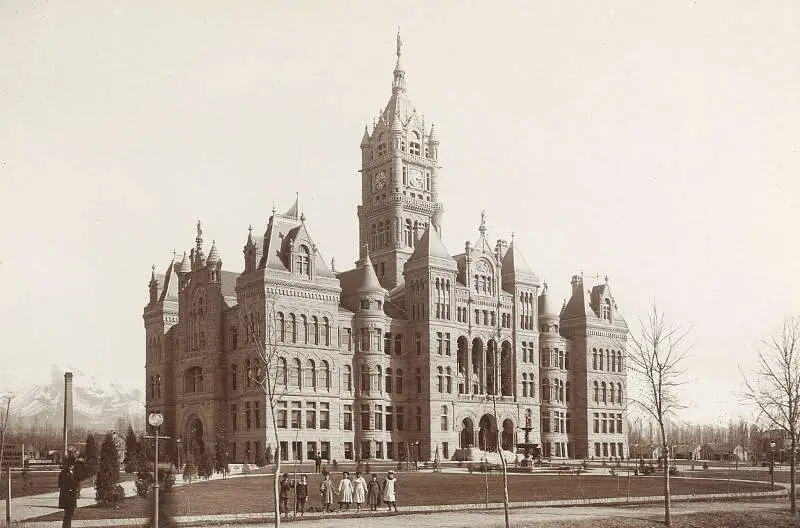
Salt Lake City, UT Photos
2 Reviews & Comments About Salt Lake City

man, I live in salt lake city, Utah and was thinking of moving to indianapolis but s**t... racism seems like a big deal over there
it's just too expensive here, can't buy a decent home for less than 250,townhouse or 300 with a yard that not even landscapes but see.s like ppl are into the black and white s**t still over there.. I'm mixed. I was there last month didn't see much Hispanics but wasn't there too long. also, don't want my kid going to a school where she feels like she's less than because she's brown.. maybe I'll just stay my brown a*s right here in Salt lake, after all we make the top places to live and for jobs all the time. just too expensive now!
Salt Lake City, Utah is one of the most beautiful, well planned cities I have ever had the pleasure of visiting. I spent my Christmas holiday there a few years ago and was blown away by its cleanliness. I could tell that the founders of the city brought to life what they had envisioned. The streets were practically spotless and the people were incredibly nice and honest. I had actually left my expensive digital camera in the restroom on accident and didn't realize it until two kind people started chasing me down to give it to me. I was shocked, because if that had happened in my hometown, the chances of someone returning such an expensive possession would have been pretty slim. I enjoyed the bars and Temple Square, which was breathtaking with all of the Christmas lights. I am not Mormon, but I thought the place looked magical.
Temple Square with all of the beautiful buildings and Christmas lights, the high end retail stores, the bars, the nice people and the clean streets. I can't think of anything bad to say.
Rankings & Articles For Salt Lake City


Locations Around Salt Lake City
Map Of Salt Lake City, UT
Best Places Around Salt Lake City
Salt Lake City Demographics And Statistics
Population over time in Salt Lake City
The current population in Salt Lake City is 208,007. The population has increased 12.7% from 2010.
| Year | Population | % Change |
|---|---|---|
| 2024 | 208,007 | 2.0% |
| 2023 | 203,888 | 1.3% |
| 2022 | 201,269 | 1.1% |
| 2021 | 199,153 | -0.5% |
| 2020 | 200,133 | 1.2% |
| 2019 | 197,756 | 1.1% |
| 2018 | 195,701 | 0.8% |
| 2017 | 194,188 | 1.4% |
| 2016 | 191,446 | 0.4% |
| 2015 | 190,679 | 0.7% |
| 2014 | 189,267 | 0.6% |
| 2013 | 188,141 | 0.8% |
| 2012 | 186,740 | 0.4% |
| 2011 | 186,009 | 0.8% |
| 2010 | 184,488 | - |
Race / Ethnicity in Salt Lake City
See the full breakdown
Salt Lake City is:
64.4% White with 133,922 White residents.
2.3% African American with 4,713 African American residents.
0.5% American Indian with 1,018 American Indian residents.
4.9% Asian with 10,257 Asian residents.
1.5% Hawaiian with 3,159 Hawaiian residents.
0.3% Other with 715 Other residents.
5.3% Two Or More with 11,022 Two Or More residents.
20.8% Hispanic with 43,201 Hispanic residents.
| Race | Salt Lake City | UT | USA |
|---|---|---|---|
| White | 64.4% | 74.7% | 57.4% |
| African American | 2.3% | 1.1% | 11.9% |
| American Indian | 0.5% | 0.6% | 0.5% |
| Asian | 4.9% | 2.4% | 5.9% |
| Hawaiian | 1.5% | 0.9% | 0.2% |
| Other | 0.3% | 0.4% | 0.6% |
| Two Or More | 5.3% | 4.0% | 4.3% |
| Hispanic | 20.8% | 15.9% | 19.3% |
Gender in Salt Lake City
See the full breakdown
Salt Lake City is 48.3% female with 100,435 female residents.
Salt Lake City is 51.7% male with 107,572 male residents.
| Gender | Salt Lake City | UT | USA |
|---|---|---|---|
| Female | 48.3% | 49.3% | 50.5% |
| Male | 51.7% | 50.7% | 49.5% |
Highest level of educational attainment in Salt Lake City for adults over 25
See the full breakdown
3.0% of adults in Salt Lake City completed < 9th grade.
4.0% of adults in Salt Lake City completed 9-12th grade.
17.0% of adults in Salt Lake City completed high school / ged.
17.0% of adults in Salt Lake City completed some college.
7.0% of adults in Salt Lake City completed associate's degree.
29.0% of adults in Salt Lake City completed bachelor's degree.
14.0% of adults in Salt Lake City completed master's degree.
5.0% of adults in Salt Lake City completed professional degree.
4.0% of adults in Salt Lake City completed doctorate degree.
| Education | Salt Lake City | UT | USA |
|---|---|---|---|
| < 9th Grade | 3.0% | 2.0% | 4.0% |
| 9-12th Grade | 4.0% | 4.0% | 6.0% |
| High School / GED | 17.0% | 22.0% | 26.0% |
| Some College | 17.0% | 23.0% | 19.0% |
| Associate's Degree | 7.0% | 10.0% | 9.0% |
| Bachelor's Degree | 29.0% | 25.0% | 22.0% |
| Master's Degree | 14.0% | 10.0% | 10.0% |
| Professional Degree | 5.0% | 2.0% | 2.0% |
| Doctorate Degree | 4.0% | 2.0% | 2.0% |
Household Income For Salt Lake City, Utah
See the full breakdown
4.7% of households in Salt Lake City earn Less than $10,000.
3.8% of households in Salt Lake City earn $10,000 to $14,999.
6.8% of households in Salt Lake City earn $15,000 to $24,999.
6.7% of households in Salt Lake City earn $25,000 to $34,999.
11.3% of households in Salt Lake City earn $35,000 to $49,999.
16.7% of households in Salt Lake City earn $50,000 to $74,999.
13.0% of households in Salt Lake City earn $75,000 to $99,999.
15.3% of households in Salt Lake City earn $100,000 to $149,999.
8.7% of households in Salt Lake City earn $150,000 to $199,999.
13.0% of households in Salt Lake City earn $200,000 or more.
| Income | Salt Lake City | UT | USA |
|---|---|---|---|
| Less than $10,000 | 4.7% | 3.1% | 5.0% |
| $10,000 to $14,999 | 3.8% | 2.0% | 3.4% |
| $15,000 to $24,999 | 6.8% | 4.0% | 6.3% |
| $25,000 to $34,999 | 6.7% | 5.0% | 6.6% |
| $35,000 to $49,999 | 11.3% | 8.8% | 10.1% |
| $50,000 to $74,999 | 16.7% | 15.5% | 15.5% |
| $75,000 to $99,999 | 13.0% | 14.2% | 12.6% |
| $100,000 to $149,999 | 15.3% | 21.6% | 17.5% |
| $150,000 to $199,999 | 8.7% | 11.9% | 9.6% |
| $200,000 or more | 13.0% | 13.9% | 13.4% |
Source: U.S. Census ACS 5-year estimates (2024)


