South Salt Lake SnackAbility
Overall SnackAbility
Crime in South Salt Lake summary. We use data from the FBI to determine the crime rates in South Salt Lake. Key points include:
There were 1,722 total crimes in South Salt Lake in the last reporting year.
The overall crime rate per 100,000 people in South Salt Lake is 6,641.0 / 100k people.
The violent crime rate per 100,000 people in South Salt Lake is 767.5 / 100k people.
The property crime rate per 100,000 people in South Salt Lake is 5,873.5 / 100k people.
Overall, crime in South Salt Lake is 213.37% above the national average.
Total Crimes
Above National Average
Crime In South Salt Lake Comparison Table
| Statistic | Count Raw |
South Salt Lake / 100k People |
Utah / 100k People |
National / 100k People |
|---|---|---|---|---|
| Total Crimes Per 100K | 1,722 | 6,641.0 | 1,638.5 | 2,119.2 |
| Violent Crime | 199 | 767.5 | 229.6 | 359.0 |
| Murder | 2 | 7.7 | 2.6 | 5.0 |
| Robbery | 39 | 150.4 | 27.3 | 61.0 |
| Aggravated Assault | 117 | 451.2 | 141.7 | 256.0 |
| Property Crime | 1,523 | 5,873.5 | 1,408.9 | 1,760.0 |
| Burglary | 161 | 620.9 | 146.6 | 229.0 |
| Larceny | 1,210 | 4,666.4 | 1,145.8 | 1,272.0 |
| Car Theft | 152 | 586.2 | 116.5 | 259.0 |
Source: FBI Uniform Crime Reporting (2024)
Cost of living in South Salt Lake summary. We use data on the cost of living to determine how expensive it is to live in South Salt Lake. Real estate prices drive most of the variance in cost of living around Utah. Key points include:
The cost of living in South Salt Lake is 110 with 100 being average.
The cost of living in South Salt Lake is 1.1x higher than the national average.
The median home value in South Salt Lake is $440,874.
The median income in South Salt Lake is $72,152.
South Salt Lake's Overall Cost Of Living
Higher Than The National Average
Cost Of Living In South Salt Lake Comparison Table
| Living Expense | South Salt Lake | Utah | National Average |
|---|---|---|---|
| Overall | 110 | 106 | 100 |
| Services | 104 | 100 | 100 |
| Groceries | 100 | 101 | 100 |
| Health | 128 | 111 | 100 |
| Housing | 96 | 103 | 100 |
| Transportation | 104 | 103 | 100 |
| Utilities | 108 | 103 | 100 |
Source: Cost of living index, normalized to US average = 100
South Salt Lake, UT Weather
The average high in South Salt Lake is 64.1° and the average low is 41.5°.
There are 47.2 days of precipitation each year.
Expect an average of 15.3 inches of precipitation each year with 59.7 inches of snow.
| Stat | South Salt Lake |
|---|---|
| Average Annual High | 64.1 |
| Average Annual Low | 41.5 |
| Annual Precipitation Days | 47.2 |
| Average Annual Precipitation | 15.3 |
| Average Annual Snowfall | 59.7 |
Average High
Days of Rain
Source: NOAA climate normals (30-year)
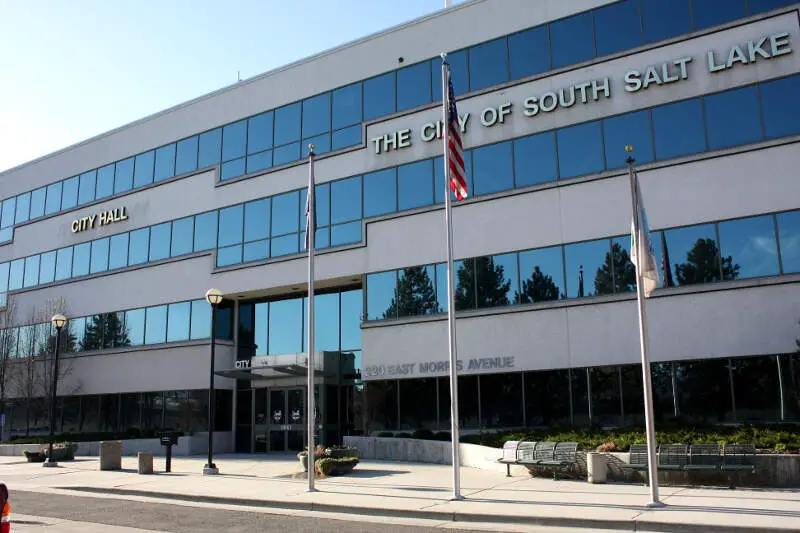
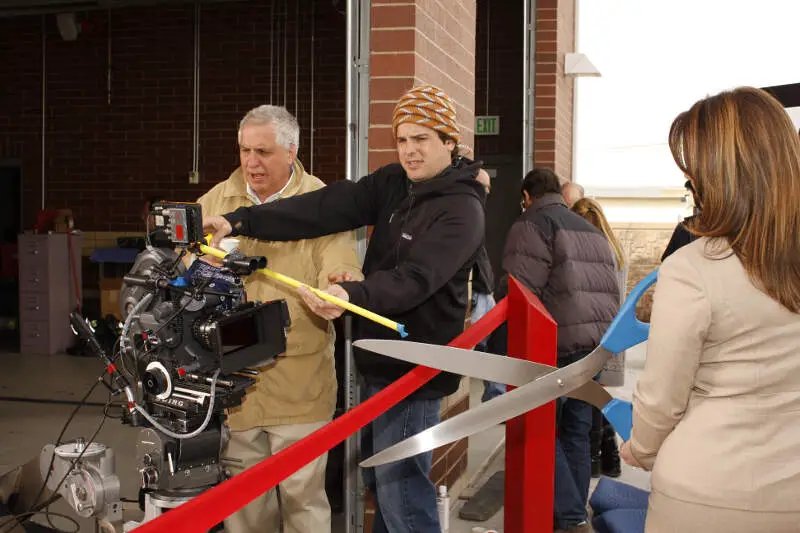
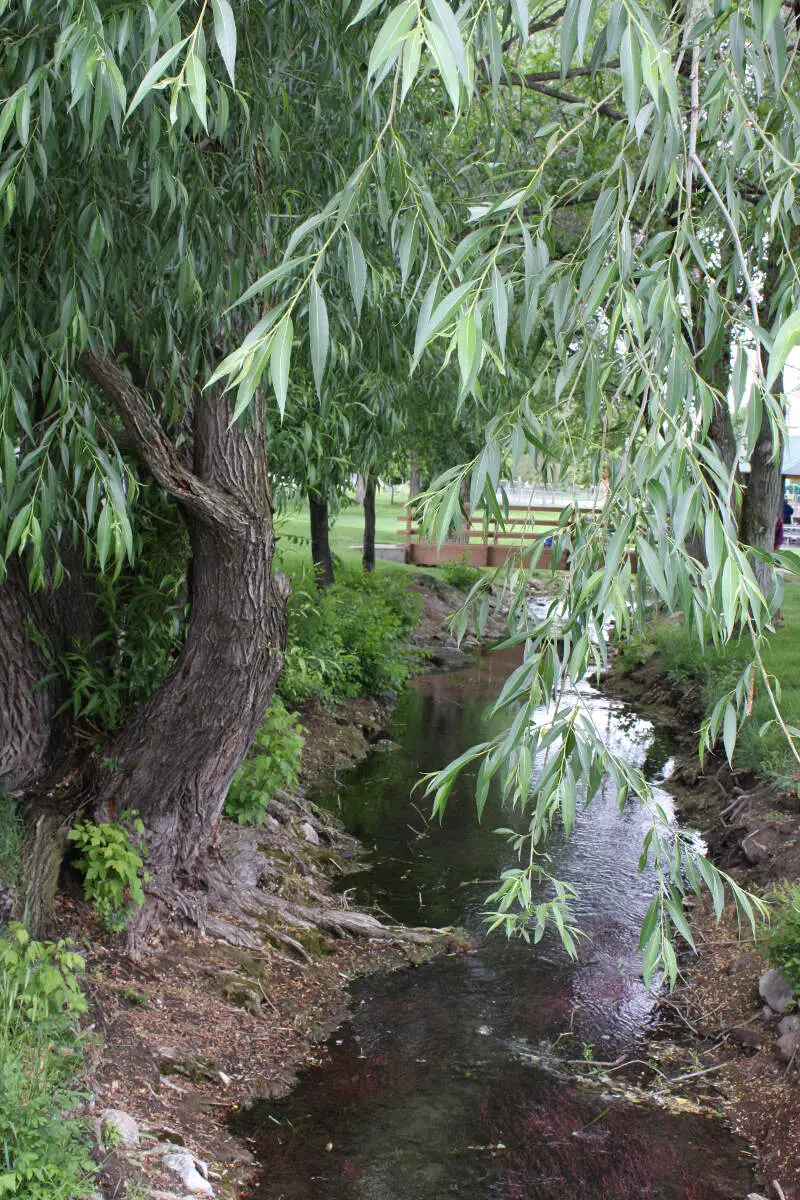
South Salt Lake, UT Photos

Rankings & Articles For South Salt Lake


Locations Around South Salt Lake
Map Of South Salt Lake, UT
Best Places Around South Salt Lake
Summit Park, UT
Population 8,537
South Jordan, UT
Population 82,686
Riverton, UT
Population 45,457
Highland, UT
Population 20,119
Cottonwood Heights, UT
Population 32,828
Draper, UT
Population 50,278
Holladay, UT
Population 31,099
Farmington, UT
Population 25,389
Sandy, UT
Population 94,291
Lehi, UT
Population 85,173
South Salt Lake Demographics And Statistics
Population over time in South Salt Lake
The current population in South Salt Lake is 26,352. The population has increased 13.4% from 2010.
| Year | Population | % Change |
|---|---|---|
| 2024 | 26,352 | 0.3% |
| 2023 | 26,277 | -0.1% |
| 2022 | 26,315 | 0.9% |
| 2021 | 26,086 | 3.8% |
| 2020 | 25,125 | 0.4% |
| 2019 | 25,017 | 0.6% |
| 2018 | 24,860 | 0.6% |
| 2017 | 24,722 | 0.6% |
| 2016 | 24,575 | 0.3% |
| 2015 | 24,501 | 0.8% |
| 2014 | 24,315 | 1.2% |
| 2013 | 24,033 | 1.3% |
| 2012 | 23,732 | 1.2% |
| 2011 | 23,461 | 1.0% |
| 2010 | 23,228 | - |
Race / Ethnicity in South Salt Lake
See the full breakdown
South Salt Lake is:
50.5% White with 13,301 White residents.
3.2% African American with 838 African American residents.
1.8% American Indian with 468 American Indian residents.
11.7% Asian with 3,076 Asian residents.
0.4% Hawaiian with 95 Hawaiian residents.
0.3% Other with 84 Other residents.
4.4% Two Or More with 1,161 Two Or More residents.
27.8% Hispanic with 7,329 Hispanic residents.
| Race | South Salt Lake | UT | USA |
|---|---|---|---|
| White | 50.5% | 74.7% | 57.4% |
| African American | 3.2% | 1.1% | 11.9% |
| American Indian | 1.8% | 0.6% | 0.5% |
| Asian | 11.7% | 2.4% | 5.9% |
| Hawaiian | 0.4% | 0.9% | 0.2% |
| Other | 0.3% | 0.4% | 0.6% |
| Two Or More | 4.4% | 4.0% | 4.3% |
| Hispanic | 27.8% | 15.9% | 19.3% |
Gender in South Salt Lake
See the full breakdown
South Salt Lake is 47.0% female with 12,384 female residents.
South Salt Lake is 53.0% male with 13,967 male residents.
| Gender | South Salt Lake | UT | USA |
|---|---|---|---|
| Female | 47.0% | 49.3% | 50.5% |
| Male | 53.0% | 50.7% | 49.5% |
Highest level of educational attainment in South Salt Lake for adults over 25
See the full breakdown
5.0% of adults in South Salt Lake completed < 9th grade.
8.0% of adults in South Salt Lake completed 9-12th grade.
25.0% of adults in South Salt Lake completed high school / ged.
19.0% of adults in South Salt Lake completed some college.
7.0% of adults in South Salt Lake completed associate's degree.
22.0% of adults in South Salt Lake completed bachelor's degree.
10.0% of adults in South Salt Lake completed master's degree.
2.0% of adults in South Salt Lake completed professional degree.
2.0% of adults in South Salt Lake completed doctorate degree.
| Education | South Salt Lake | UT | USA |
|---|---|---|---|
| < 9th Grade | 5.0% | 2.0% | 4.0% |
| 9-12th Grade | 8.0% | 4.0% | 6.0% |
| High School / GED | 25.0% | 22.0% | 26.0% |
| Some College | 19.0% | 23.0% | 19.0% |
| Associate's Degree | 7.0% | 10.0% | 9.0% |
| Bachelor's Degree | 22.0% | 25.0% | 22.0% |
| Master's Degree | 10.0% | 10.0% | 10.0% |
| Professional Degree | 2.0% | 2.0% | 2.0% |
| Doctorate Degree | 2.0% | 2.0% | 2.0% |
Household Income For South Salt Lake, Utah
See the full breakdown
4.4% of households in South Salt Lake earn Less than $10,000.
3.6% of households in South Salt Lake earn $10,000 to $14,999.
4.1% of households in South Salt Lake earn $15,000 to $24,999.
5.8% of households in South Salt Lake earn $25,000 to $34,999.
11.6% of households in South Salt Lake earn $35,000 to $49,999.
22.1% of households in South Salt Lake earn $50,000 to $74,999.
16.4% of households in South Salt Lake earn $75,000 to $99,999.
14.0% of households in South Salt Lake earn $100,000 to $149,999.
10.7% of households in South Salt Lake earn $150,000 to $199,999.
7.4% of households in South Salt Lake earn $200,000 or more.
| Income | South Salt Lake | UT | USA |
|---|---|---|---|
| Less than $10,000 | 4.4% | 3.1% | 5.0% |
| $10,000 to $14,999 | 3.6% | 2.0% | 3.4% |
| $15,000 to $24,999 | 4.1% | 4.0% | 6.3% |
| $25,000 to $34,999 | 5.8% | 5.0% | 6.6% |
| $35,000 to $49,999 | 11.6% | 8.8% | 10.1% |
| $50,000 to $74,999 | 22.1% | 15.5% | 15.5% |
| $75,000 to $99,999 | 16.4% | 14.2% | 12.6% |
| $100,000 to $149,999 | 14.0% | 21.6% | 17.5% |
| $150,000 to $199,999 | 10.7% | 11.9% | 9.6% |
| $200,000 or more | 7.4% | 13.9% | 13.4% |
Source: U.S. Census ACS 5-year estimates (2024)


