100 Biggest Cities In Vermont For 2026
Using the latest Census data, we detail the 100 biggest cities in Vermont. You can all see a comprehensive list of all 45 cities and places in Vermont.

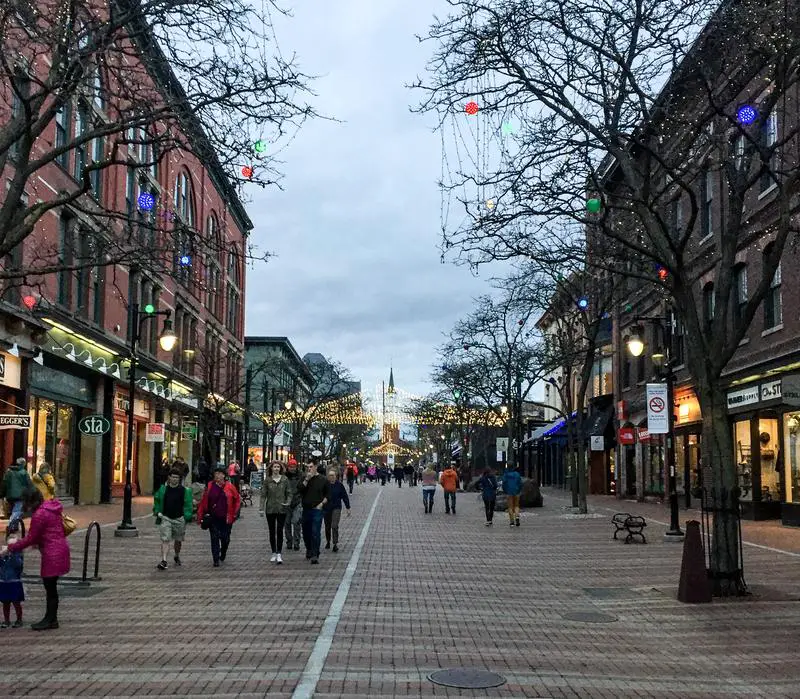
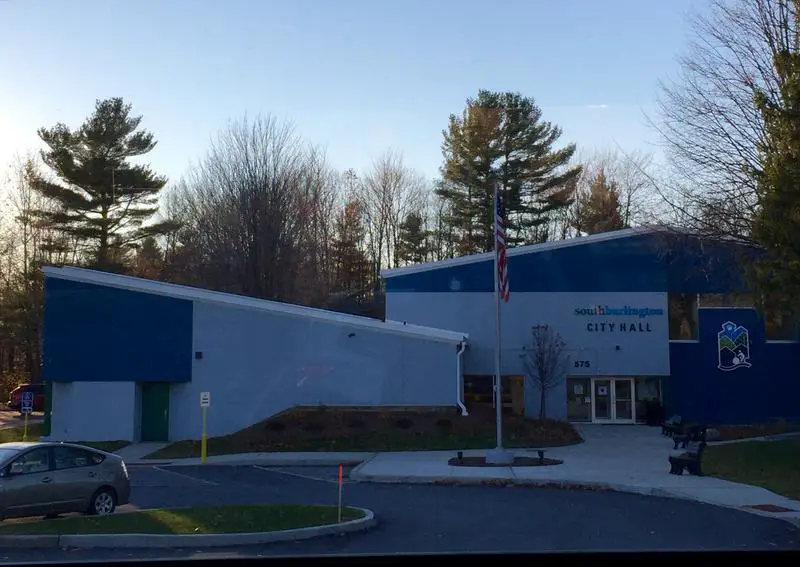
We all love the biggest cities that the Green Mountain State has to offer. You know the places like Burlington and South Burlington which make all the headlines.
But there are a bunch of other great large cities in Vermont that don't get as much love.
We're going to change that right now.
Using the most recent Census data, we can tell you about all the places in Vermont with a focus on the biggest. We update the data each year and this is our fourth time doing this.
Table Of Contents: Top Ten | Methodology | Table
The Largest Cities In Vermont For 2026:
You can click here to see a full table of the full of the 100 biggest cities in Vermont, along with every other place over 1,000 people big. It is sortable by clicking on the headers.
Read on below to see more on the biggest cities. Or for more reading on places to live in Vermont, check out:
The 10 Biggest Cities In Vermont

/10
Rank Last Year: 1 (No Change)
Population: 44,675.0
Population 2010: 41,935
Growth: 6.5%
More on Burlington: Data | Crime | Cost Of Living | Real Estate

/10
Rank Last Year: 2 (No Change)
Population: 20,756.0
Population 2010: 17,356
Growth: 19.6%
More on South Burlington: Data | Crime | Cost Of Living | Real Estate

/10
Rank Last Year: 3 (No Change)
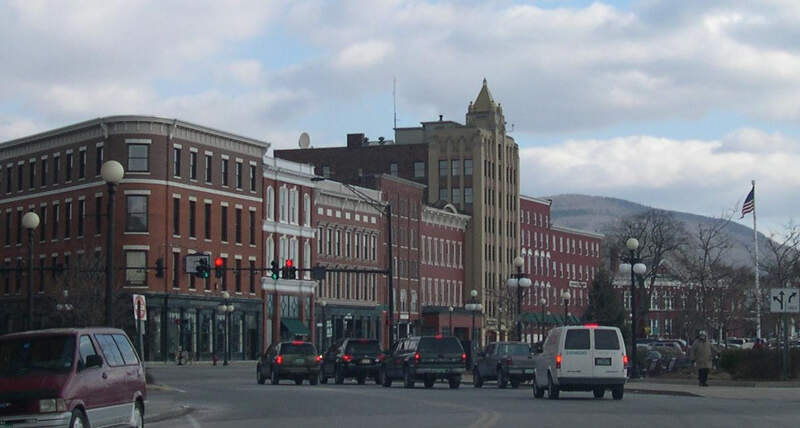
Population: 15,712.0
Population 2010: 16,739
Growth: -6.1%
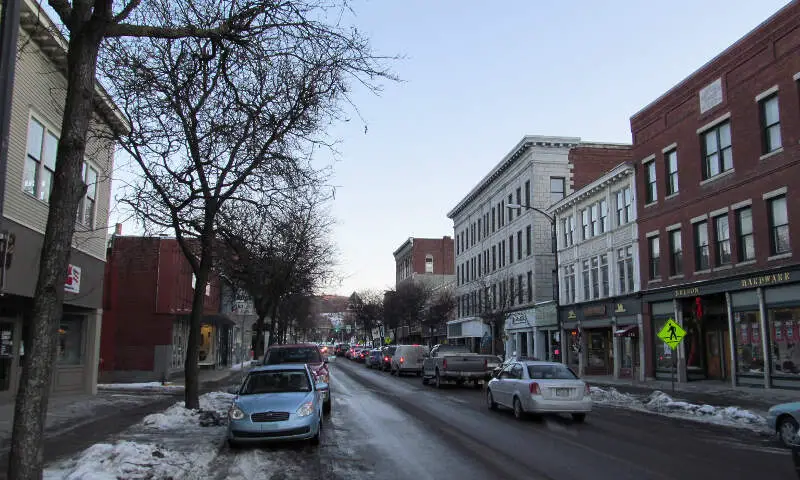
More on Rutland: Data | Crime | Cost Of Living | Real Estate

/10
Rank Last Year: 4 (No Change)
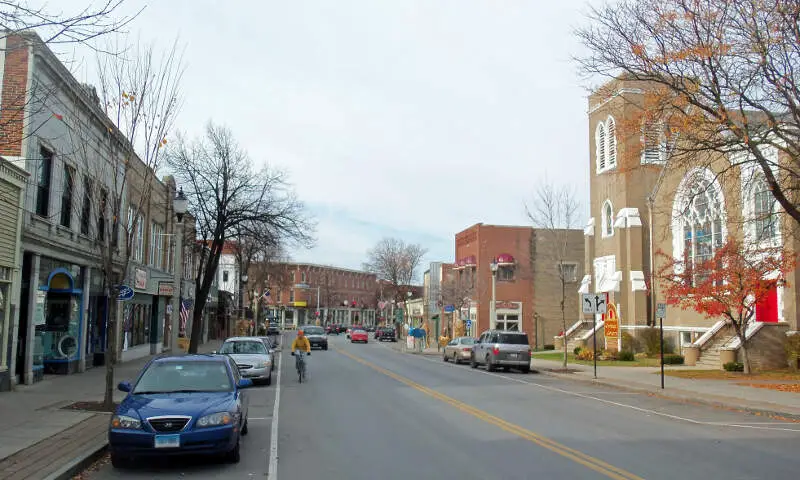
Population: 9,245.0
Population 2010: 8,969
Growth: 3.1%
More on Bennington: Data | Crime | Cost Of Living | Real Estate

/10
Rank Last Year: 5 (No Change)
Population: 8,412.0
Population 2010: 9,112
Growth: -7.7%
More on Barre: Data | Crime | Cost Of Living | Real Estate

/10
Rank Last Year: 6 (No Change)
Population: 8,293.0
Population 2010: 7,133
Growth: 16.3%
More on Winooski: Data | Crime | Cost Of Living | Real Estate

/10
Rank Last Year: 7 (No Change)
Population: 8,014.0
Population 2010: 7,903
Growth: 1.4%
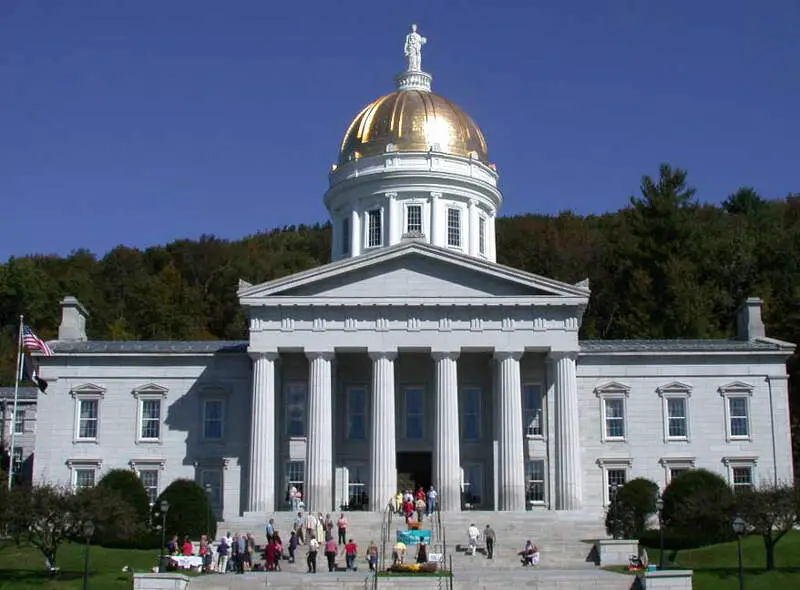
More on Montpelier: Data | Crime | Cost Of Living | Real Estate

/10
Rank Last Year: 8 (No Change)
Population: 7,657.0
Population 2010: 7,136
Growth: 7.3%
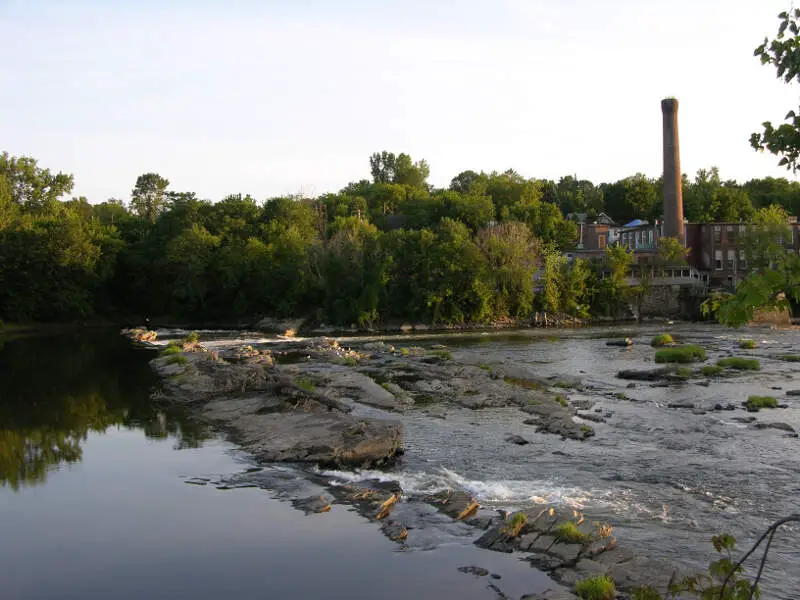
More on Brattleboro: Data | Crime | Cost Of Living | Real Estate

/10
Rank Last Year: 9 (No Change)
Population: 7,220.0
Population 2010: 6,526
Growth: 10.6%
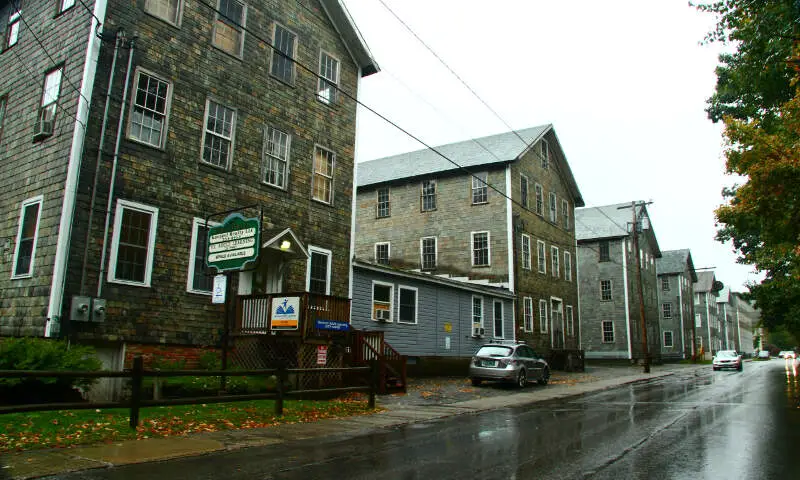
More on Middlebury: Data | Crime | Cost Of Living | Real Estate

/10
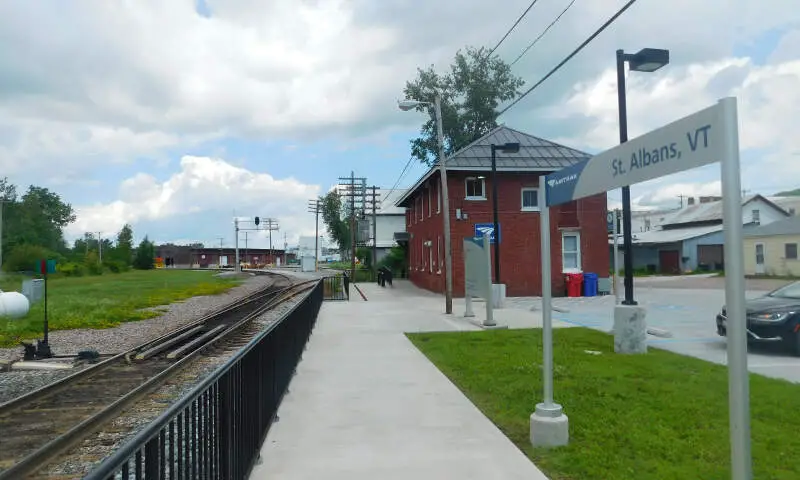
Rank Last Year: 10 (No Change)
Population: 6,954.0
Population 2010: 7,044
Growth: -1.3%
More on St. Albans: Data | Crime | Cost Of Living | Real Estate
How We Determined The Largest Cities In Vermont
We've been ranking and dissecting cities in the Green Mountain State for over 4 years now -- making this actually the fourth time we've run the numbers. We always use the best data, the US Census. In this case, that means we are using the American Community Survey.
It what is probably the most simple analysis we run each year, we ranked every place in Vermont from biggest to smallest. The biggest city this year? That would be Burlington.
The smallest? Stowe, although there are places smaller than 1,000 people not listed here, so keep that in mind as we take a look at the top ten.
Now on to numbers 11-100 Biggest in Vermont
We hope that you find the big city, or really any city, that's right for you. Below is a list of the rest of the biggest cities along with every other place in Vermont.
Have fun snacking around in the Green Mountain State!
For more reading on Vermont, check out:
- Best Places To Raise A Family In Vermont
- Best Places To Retire In Vermont
- Richest Cities In Vermont
- Safest Places In Vermont
- Worst Places To Live In Vermont
- Most Expensive Places To Live In Vermont
Detailed List Of The Biggest Cities In Vermont
| Rank | City | Current Population | 2010 | Growth | |||||
|---|---|---|---|---|---|---|---|---|---|
| 1 | Burlington | 44,675.0 | 41,935 | 6.5% | |||||
| 2 | South Burlington | 20,756.0 | 17,356 | 19.6% | |||||
| 3 | Rutland | 15,712.0 | 16,739 | -6.1% | |||||
| 4 | Bennington | 9,245.0 | 8,969 | 3.1% | |||||
| 5 | Barre | 8,412.0 | 9,112 | -7.7% | |||||
| 6 | Winooski | 8,293.0 | 7,133 | 16.3% | |||||
| 7 | Montpelier | 8,014.0 | 7,903 | 1.4% | |||||
| 8 | Brattleboro | 7,657.0 | 7,136 | 7.3% | |||||
| 9 | Middlebury | 7,220.0 | 6,526 | 10.6% | |||||
| 10 | St. Albans | 6,954.0 | 7,044 | -1.3% | |||||
| 11 | Shelburne | 6,499.0 | 680 | 855.7% | |||||
| 12 | St. Johnsbury | 5,859.0 | 6,722 | -12.8% | |||||
| 13 | Newport | 4,394.0 | 4,701 | -6.5% | |||||
| 14 | Springfield | 4,237.0 | 3,705 | 14.4% | |||||
| 15 | Milton | 3,555.0 | 1,925 | 84.7% | |||||
| 16 | White River Junction | 3,364.0 | 2,272 | 48.1% | |||||
| 17 | Wilder | 3,087.0 | 1,545 | 99.8% | |||||
| 18 | Bellows Falls | 2,891.0 | 3,326 | -13.1% | |||||
| 19 | West Brattleboro | 2,749.0 | 2,751 | -0.1% | |||||
| 20 | Swanton | 2,670.0 | 2,454 | 8.8% | |||||
| 21 | Morrisville | 2,664.0 | 2,053 | 29.8% | |||||
| 22 | Vergennes | 2,565.0 | 2,621 | -2.1% | |||||
| 23 | Fair Haven | 2,537.0 | 2,218 | 14.4% | |||||
| 24 | Bristol | 2,142.0 | 1,960 | 9.3% | |||||
| 25 | West Rutland | 2,125.0 | 2,362 | -10.0% | |||||
| 26 | Windsor | 2,060.0 | 2,114 | -2.6% | |||||
| 27 | Manchester Center | 2,037.0 | 2,056 | -0.9% | |||||
| 28 | Randolph | 2,007.0 | 1,728 | 16.1% | |||||
| 29 | Brandon | 1,927.0 | 1,813 | 6.3% | |||||
| 30 | Johnson | 1,799.0 | 1,711 | 5.1% | |||||
| 31 | Williamstown | 1,660.0 | 1,275 | 30.2% | |||||
| 32 | Arlington | 1,623.0 | 1,230 | 32.0% | |||||
| 33 | Richford | 1,573.0 | 1,492 | 5.4% | |||||
| 34 | Enosburg Falls | 1,570.0 | 1,508 | 4.1% | |||||
| 35 | South Barre | 1,346.0 | 1,006 | 33.8% | |||||
| 36 | Jericho | 1,346.0 | 1,532 | -12.1% | |||||
| 37 | North Bennington | 1,336.0 | 1,560 | -14.4% | |||||
| 38 | Chester | 1,298.0 | 1,013 | 28.1% | |||||
| 39 | Norwich | 1,147.0 | 1,025 | 11.9% | |||||
| 40 | Bradford | 1,097.0 | 679 | 61.6% | |||||
| 41 | Castleton | 1,052.0 | 1,632 | -35.5% | |||||
| 42 | Hardwick | 1,046.0 | 1,269 | -17.6% | |||||
| 43 | Poultney | 1,033.0 | 1,863 | -44.6% | |||||
| 44 | East Barre | 1,017.0 | 619 | 64.3% | |||||
| 45 | Stowe | 1,003.0 | 887 | 13.1% | |||||