Bellevue SnackAbility
Overall SnackAbility
Crime in Bellevue summary. We use data from the FBI to determine the crime rates in Bellevue. Key points include:
There were 5,270 total crimes in Bellevue in the last reporting year.
The overall crime rate per 100,000 people in Bellevue is 3,478.1 / 100k people.
The violent crime rate per 100,000 people in Bellevue is 138.6 / 100k people.
The property crime rate per 100,000 people in Bellevue is 3,339.5 / 100k people.
Overall, crime in Bellevue is 64.12% above the national average.
Total Crimes
Above National Average
Crime In Bellevue Comparison Table
| Statistic | Count Raw |
Bellevue / 100k People |
Washington / 100k People |
National / 100k People |
|---|---|---|---|---|
| Total Crimes Per 100K | 5,270 | 3,478.1 | 2,792.6 | 2,119.2 |
| Violent Crime | 210 | 138.6 | 326.1 | 359.0 |
| Murder | 1 | 0.7 | 3.8 | 5.0 |
| Robbery | 77 | 50.8 | 67.5 | 61.0 |
| Aggravated Assault | 117 | 77.2 | 217.0 | 256.0 |
| Property Crime | 5,060 | 3,339.5 | 2,466.5 | 1,760.0 |
| Burglary | 549 | 362.3 | 398.8 | 229.0 |
| Larceny | 3,995 | 2,636.6 | 1,634.2 | 1,272.0 |
| Car Theft | 516 | 340.5 | 433.5 | 259.0 |
Source: FBI Uniform Crime Reporting (2024)
Cost of living in Bellevue summary. We use data on the cost of living to determine how expensive it is to live in Bellevue. Real estate prices drive most of the variance in cost of living around Washington. Key points include:
The cost of living in Bellevue is 202 with 100 being average.
The cost of living in Bellevue is 2.0x higher than the national average.
The median home value in Bellevue is $1,516,153.
The median income in Bellevue is $165,576.
Bellevue's Overall Cost Of Living
Higher Than The National Average
Cost Of Living In Bellevue Comparison Table
| Living Expense | Bellevue | Washington | National Average |
|---|---|---|---|
| Overall | 202 | 120 | 100 |
| Services | 112 | 108 | 100 |
| Groceries | 112 | 108 | 100 |
| Health | 408 | 137 | 100 |
| Housing | 118 | 111 | 100 |
| Transportation | 117 | 111 | 100 |
| Utilities | 120 | 110 | 100 |
Source: Cost of living index, normalized to US average = 100
Bellevue, WA Weather
The average high in Bellevue is 59.9° and the average low is 44.1°.
There are 97.7 days of precipitation each year.
Expect an average of 41.3 inches of precipitation each year with 4.9 inches of snow.
| Stat | Bellevue |
|---|---|
| Average Annual High | 59.9 |
| Average Annual Low | 44.1 |
| Annual Precipitation Days | 97.7 |
| Average Annual Precipitation | 41.3 |
| Average Annual Snowfall | 4.9 |
Average High
Days of Rain
Source: NOAA climate normals (30-year)
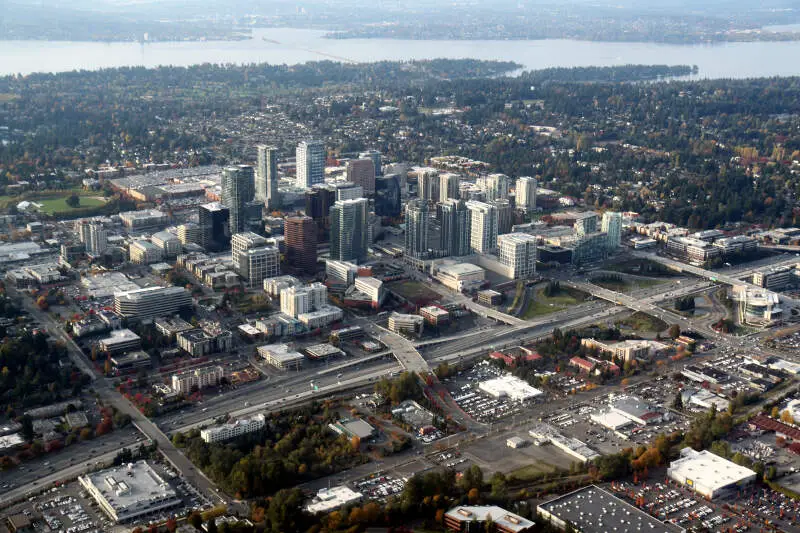
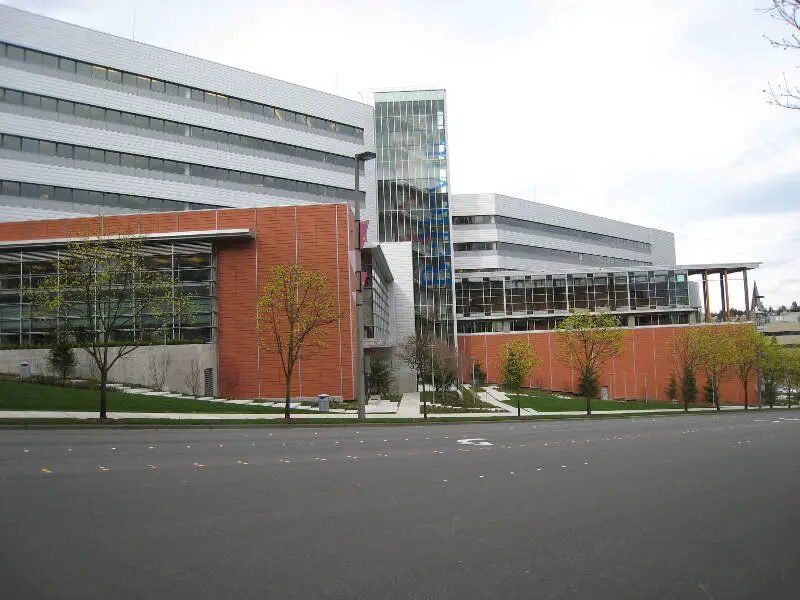
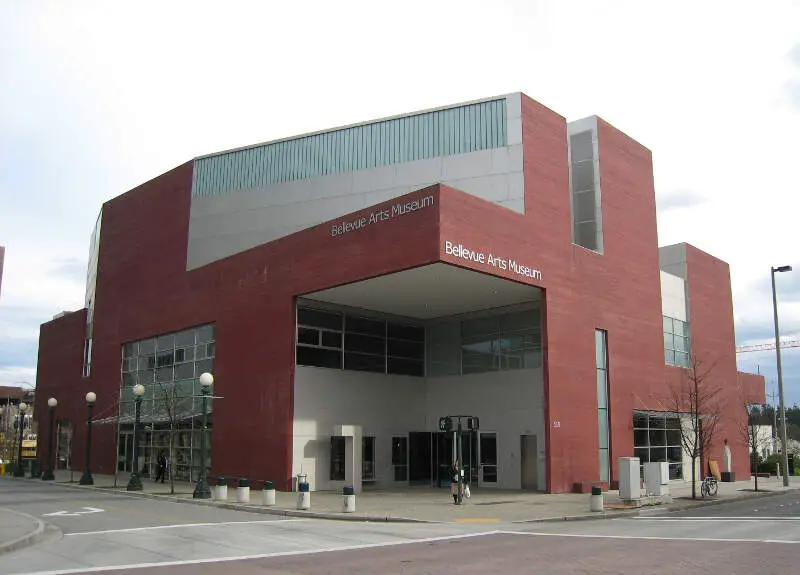
Bellevue, WA Photos


Rankings & Articles For Bellevue


Locations Around Bellevue
Map Of Bellevue, WA
Best Places Around Bellevue
Bainbridge Island, WA
Population 24,631
Vashon, WA
Population 9,934
SeaTac, WA
Population 32,414
Kent, WA
Population 135,603
Tukwila, WA
Population 21,451
Lake Stickney, WA
Population 15,890
White Center, WA
Population 14,886
Monroe, WA
Population 19,755
Lynnwood, WA
Population 40,110
Bryn Mawr-Skyway, WA
Population 17,638
Bellevue Demographics And Statistics
Population over time in Bellevue
The current population in Bellevue is 151,847. The population has increased 27.1% from 2010.
| Year | Population | % Change |
|---|---|---|
| 2024 | 151,847 | 0.4% |
| 2023 | 151,199 | 0.4% |
| 2022 | 150,606 | 0.8% |
| 2021 | 149,365 | 2.2% |
| 2020 | 146,145 | 1.2% |
| 2019 | 144,403 | 1.5% |
| 2018 | 142,242 | 2.3% |
| 2017 | 139,014 | 1.7% |
| 2016 | 136,718 | 1.6% |
| 2015 | 134,630 | 1.8% |
| 2014 | 132,268 | 2.4% |
| 2013 | 129,209 | 5.2% |
| 2012 | 122,873 | 1.4% |
| 2011 | 121,134 | 1.4% |
| 2010 | 119,454 | - |
Race / Ethnicity in Bellevue
See the full breakdown
Bellevue is:
39.9% White with 60,636 White residents.
2.6% African American with 3,915 African American residents.
0.1% American Indian with 101 American Indian residents.
42.7% Asian with 64,808 Asian residents.
0.3% Hawaiian with 490 Hawaiian residents.
0.7% Other with 1,102 Other residents.
5.8% Two Or More with 8,859 Two Or More residents.
7.9% Hispanic with 11,936 Hispanic residents.
| Race | Bellevue | WA | USA |
|---|---|---|---|
| White | 39.9% | 63.1% | 57.4% |
| African American | 2.6% | 3.8% | 11.9% |
| American Indian | 0.1% | 0.8% | 0.5% |
| Asian | 42.7% | 9.7% | 5.9% |
| Hawaiian | 0.3% | 0.7% | 0.2% |
| Other | 0.7% | 0.6% | 0.6% |
| Two Or More | 5.8% | 6.8% | 4.3% |
| Hispanic | 7.9% | 14.4% | 19.3% |
Gender in Bellevue
See the full breakdown
Bellevue is 49.5% female with 75,104 female residents.
Bellevue is 50.5% male with 76,743 male residents.
| Gender | Bellevue | WA | USA |
|---|---|---|---|
| Female | 49.5% | 49.6% | 50.5% |
| Male | 50.5% | 50.4% | 49.5% |
Highest level of educational attainment in Bellevue for adults over 25
See the full breakdown
2.0% of adults in Bellevue completed < 9th grade.
2.0% of adults in Bellevue completed 9-12th grade.
8.0% of adults in Bellevue completed high school / ged.
10.0% of adults in Bellevue completed some college.
5.0% of adults in Bellevue completed associate's degree.
36.0% of adults in Bellevue completed bachelor's degree.
27.0% of adults in Bellevue completed master's degree.
5.0% of adults in Bellevue completed professional degree.
5.0% of adults in Bellevue completed doctorate degree.
| Education | Bellevue | WA | USA |
|---|---|---|---|
| < 9th Grade | 2.0% | 4.0% | 4.0% |
| 9-12th Grade | 2.0% | 4.0% | 6.0% |
| High School / GED | 8.0% | 22.0% | 26.0% |
| Some College | 10.0% | 21.0% | 19.0% |
| Associate's Degree | 5.0% | 10.0% | 9.0% |
| Bachelor's Degree | 36.0% | 24.0% | 22.0% |
| Master's Degree | 27.0% | 11.0% | 10.0% |
| Professional Degree | 5.0% | 2.0% | 2.0% |
| Doctorate Degree | 5.0% | 2.0% | 2.0% |
Household Income For Bellevue, Washington
See the full breakdown
2.9% of households in Bellevue earn Less than $10,000.
1.9% of households in Bellevue earn $10,000 to $14,999.
3.1% of households in Bellevue earn $15,000 to $24,999.
2.9% of households in Bellevue earn $25,000 to $34,999.
4.4% of households in Bellevue earn $35,000 to $49,999.
7.1% of households in Bellevue earn $50,000 to $74,999.
7.6% of households in Bellevue earn $75,000 to $99,999.
15.7% of households in Bellevue earn $100,000 to $149,999.
12.4% of households in Bellevue earn $150,000 to $199,999.
41.9% of households in Bellevue earn $200,000 or more.
| Income | Bellevue | WA | USA |
|---|---|---|---|
| Less than $10,000 | 2.9% | 3.9% | 5.0% |
| $10,000 to $14,999 | 1.9% | 2.5% | 3.4% |
| $15,000 to $24,999 | 3.1% | 4.6% | 6.3% |
| $25,000 to $34,999 | 2.9% | 5.0% | 6.6% |
| $35,000 to $49,999 | 4.4% | 8.2% | 10.1% |
| $50,000 to $74,999 | 7.1% | 14.1% | 15.5% |
| $75,000 to $99,999 | 7.6% | 12.4% | 12.6% |
| $100,000 to $149,999 | 15.7% | 19.2% | 17.5% |
| $150,000 to $199,999 | 12.4% | 11.4% | 9.6% |
| $200,000 or more | 41.9% | 18.5% | 13.4% |
Source: U.S. Census ACS 5-year estimates (2024)


