You might have to win the Washington lottery to live in The Evergreen State’s wealthiest places.
Now, if you’ve never been lucky, you might want to listen up if you’re thinking about calling one of Washington’s richest places home. We believe that you can increase your luck if you take a look at our list of the top ten richest cities in this Pacific Northwest Paradise for 2026.
But first, here’s some insight into how we identified the top ten. To determine Washington’s richest places, we looked at home prices and incomes from the Zillow and the Census for 144 Washington cities with more than 3,000 residents. If you live in the greater Seattle and Tacoma areas, you are Washington’s one percent. Don’t be surprised to rub elbows with the Joneses.
But, if you don’t live where wealthy Washingtonians are ‘rolling in the dough,’ you’ll need to find a job that makes at least $160,278/year. And currently, the highest-paying jobs are in healthcare and aviation.
$250,001 median income · 2.6% poverty · #1 income in Washington
Data | Crime | Cost of living | Movers
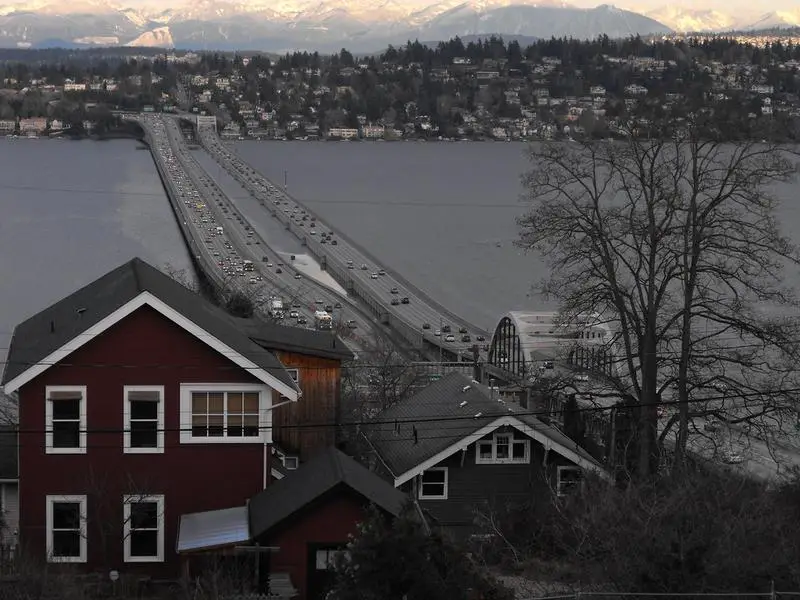
$219,069 median income · 3.8% poverty · #3 income in Washington
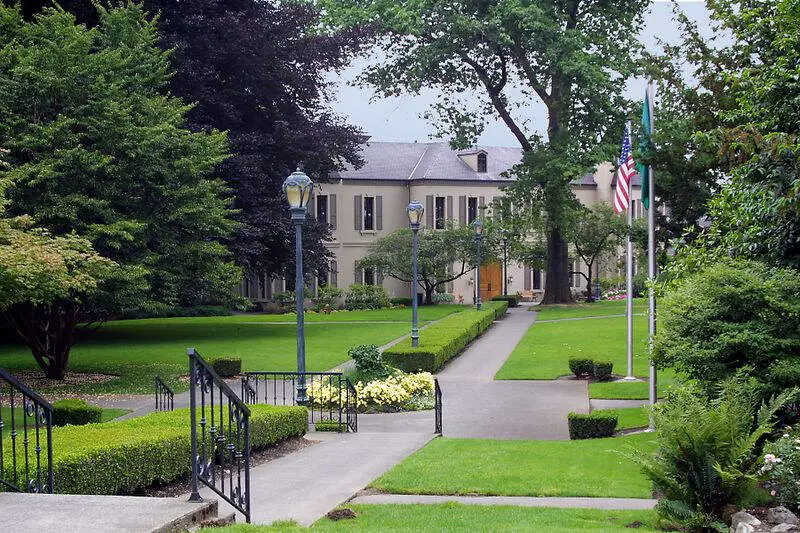
Mercer Island is a city in King County, Washington, United States located on an island of the same name in the southern portion of Lake Washington. Mercer Island is in the Seattle Metropolitan Area, with Seattle located to its west and Bellevue located to its east.
Data | Crime | Cost of living | Movers
$239,690 median income · 4.3% poverty · #2 income in Washington
Sammamish is a city in King County, Washington, United States. The population was 63,773 in a 2016 census estimate. Located on a plateau, the city is bordered by Lake Sammamish to the west and the Snoqualmie Valley to the east.
Data | Crime | Cost of living | Movers
$165,576 median income · 7.2% poverty · #8 income in Washington
Data | Crime | Cost of living | Movers
$214,107 median income · 0.8% poverty · #4 income in Washington
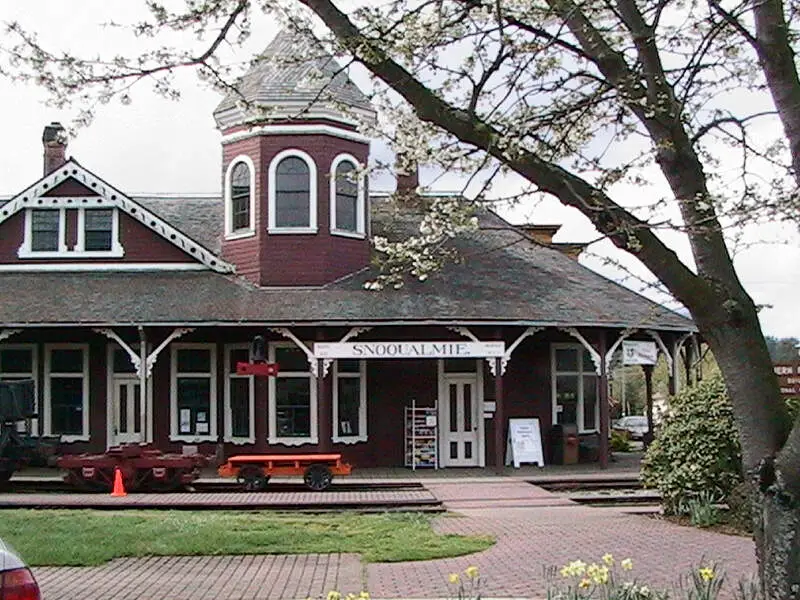
Snoqualmie is a city next to Snoqualmie Falls in King County, Washington. It is twenty-five miles east of Seattle. This city is home to the Northwest Railway Museum. The population was 13,190 in a 2016 census estimate.
Data | Crime | Cost of living | Movers
$164,398 median income · 2.9% poverty · #9 income in Washington
Woodinville is a city in King County, Washington, United States. The population was 10,938 at the 2010 census. It is part of the Seattle metropolitan area. There is also a much larger population with Woodinville mailing addresses in adjacent unincorporated areas of King and Snohomish counties. Woodinville has waterfront parks on the Sammamish River, sweeping winery and brewery grounds, and densely wooded residential areas.
Data | Crime | Cost of living | Movers
$172,188 median income · 3.5% poverty · #7 income in Washington
Bainbridge Island is a city in Kitsap County, Washington, United States, and is coextensive with the eponymous island in Puget Sound. The population was 23,025 at the 2010 census, making Bainbridge Island the second largest city in Kitsap County.
Data | Crime | Cost of living | Movers
$162,560 median income · 5.6% poverty · #10 income in Washington
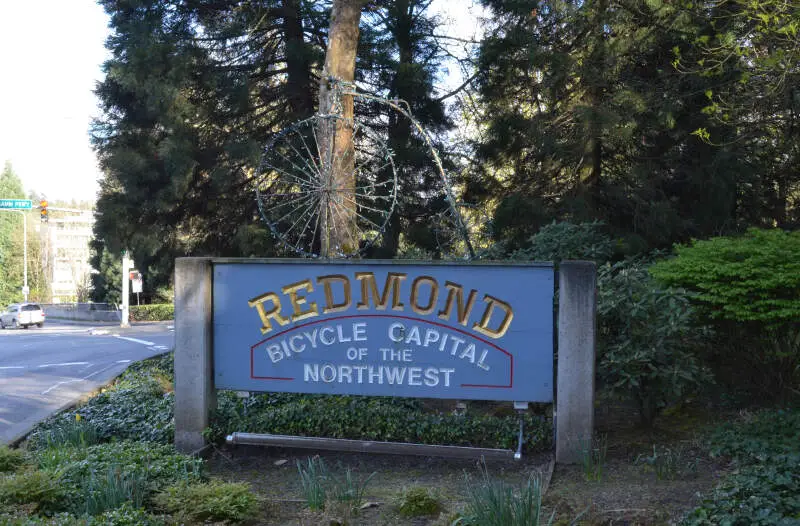
Redmond is a city in King County, Washington, United States, located 16 miles east of Seattle, within the high-tech enclave of Seattle metropolitan area. The population is 62,458 in 2016, an increase from the 2010 census, up from 45,256 in the 2000 census. Redmond is commonly recognized as the home of Microsoft and Nintendo of America. With an annual bike race on city streets and the state’s only velodrome, Redmond is also known as the “Bicycle Capital of the Northwest”.
Data | Crime | Cost of living | Movers
$160,278 median income · 5.9% poverty · #12 income in Washington
Newcastle is an Eastside city in King County, Washington, United States. Its population was 10,380 at the 2010 census.
Data | Crime | Cost of living | Movers
$175,109 median income · 4.1% poverty · #6 income in Washington
North Bend is a city in King County, Washington, United States on the outskirts of the Seattle, Washington metropolitan area. The population was 6,739 in a 2016 census estimate.
Data | Crime | Cost of living | Movers
The receipts
Compare the top ten
Pick a metric. The bars rescale. The red line is Washington’s statewide median.
Washington statewide median: $98,141
Washington statewide median: $601,016
Washington statewide median: 9.9%
Washington statewide median: 5.1%
On the map
Where the money lives in Washington
Saturday Night Science
How we determined the richest places in Washington for 2026
The first thing most people reach for is personal income. After all, rich people have really high salaries. But one statistic doesn’t capture what it means to be one of the “richest places,” so we applied Saturday Night Science to two measures from the 2020-2024 American Community Survey:
- Median household income
- Median home value
Median household income is the most digestible way to understand how rich a place is, and home values are a measure of accumulated wealth. The two combine to define a “Rich City.”
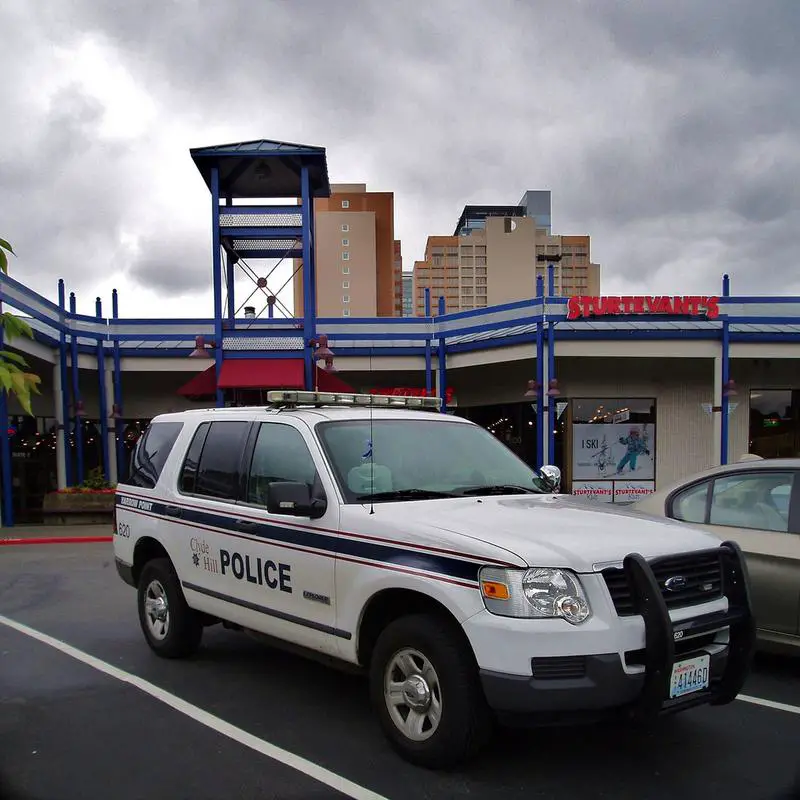
After collecting the data for all 144 places in Washington with more than 3,000 people, we ranked each place from 1 to 144 on both criteria, then averaged the two ranks into a “Rich Score.” The place with the lowest Rich Score, Clyde Hill, is crowned the richest city in Washington for 2026.
The full plate
All 100 richest cities in Washington, ranked
Click any column to sort. Search by city name.
| Rank | City | Rich Score | Population | Median income | Median home value | Poverty | Unemployment |
|---|---|---|---|---|---|---|---|
| 1 | Clyde Hill | 1.00 | 3,119 | $250,001 | $4,133,450 | 2.6% | 4.7% |
| 2 | Mercer Island | 2.50 | 25,307 | $219,069 | $2,326,984 | 3.8% | 3.0% |
| 3 | Sammamish | 2.50 | 66,463 | $239,690 | $1,627,993 | 4.3% | 3.1% |
| 4 | Bellevue | 6.00 | 151,847 | $165,576 | $1,516,154 | 7.2% | 4.2% |
| 5 | Snoqualmie | 7.50 | 13,798 | $214,107 | $1,122,657 | 0.8% | 2.6% |
| 6 | Woodinville | 8.00 | 13,438 | $164,398 | $1,390,134 | 2.9% | 4.3% |
| 7 | Bainbridge Island | 8.00 | 24,631 | $172,188 | $1,173,703 | 3.5% | 2.8% |
| 8 | Redmond | 8.00 | 77,353 | $162,560 | $1,402,276 | 5.6% | 4.9% |
| 9 | Newcastle | 8.50 | 12,989 | $160,278 | $1,424,187 | 5.9% | 5.6% |
| 10 | North Bend | 11.50 | 7,953 | $175,109 | $1,008,581 | 4.1% | 2.3% |
| 11 | Issaquah | 12.00 | 39,591 | $154,669 | $1,158,594 | 5.2% | 3.3% |
| 12 | Kirkland | 12.00 | 92,621 | $150,414 | $1,265,788 | 6.1% | 4.6% |
| 13 | Duvall | 12.00 | 8,526 | $197,361 | $980,302 | 12.8% | 2.5% |
| 14 | Normandy Park | 12.50 | 6,659 | $162,476 | $1,050,869 | 4.9% | 2.3% |
| 15 | Lake Forest Park | 13.00 | 13,335 | $159,904 | $1,054,029 | 4.0% | 4.4% |
| 16 | Bothell | 15.50 | 49,610 | $140,427 | $1,061,138 | 4.8% | 3.9% |
| 17 | Kenmore | 17.50 | 23,741 | $139,764 | $1,046,652 | 5.7% | 3.8% |
| 18 | Maple Valley | 20.50 | 28,287 | $152,885 | $799,653 | 4.8% | 4.8% |
| 19 | Brier | 20.50 | 6,545 | $132,045 | $1,012,104 | 6.7% | 3.3% |
| 20 | Mill Creek | 22.50 | 20,956 | $124,364 | $981,773 | 6.4% | 4.5% |
| 21 | Black Diamond | 22.50 | 5,961 | $141,383 | $776,133 | 2.1% | 1.3% |
| 22 | Mukilteo | 23.00 | 21,323 | $132,861 | $933,199 | 5.7% | 3.1% |
| 23 | Camas | 24.00 | 27,007 | $141,126 | $751,543 | 5.0% | 4.0% |
| 24 | Edmonds | 24.50 | 42,735 | $122,449 | $942,131 | 3.8% | 4.1% |
| 25 | Seattle | 25.50 | 754,195 | $123,860 | $868,680 | 9.9% | 4.6% |
| 26 | Covington | 30.00 | 21,233 | $134,502 | $678,607 | 5.0% | 4.1% |
| 27 | Gig Harbor | 30.00 | 12,424 | $118,395 | $820,740 | 7.0% | 2.7% |
| 28 | Bonney Lake | 30.00 | 22,090 | $136,845 | $676,348 | 4.5% | 3.6% |
| 29 | Shoreline | 32.50 | 61,431 | $112,751 | $831,857 | 8.8% | 4.6% |
| 30 | Lake Stevens | 32.50 | 40,253 | $122,336 | $705,682 | 5.2% | 4.8% |
| 31 | Enumclaw | 34.00 | 12,798 | $121,250 | $680,130 | 7.5% | 3.7% |
| 32 | Edgewood | 34.50 | 13,032 | $116,132 | $737,911 | 4.6% | 1.8% |
| 33 | Buckley | 36.50 | 5,371 | $124,583 | $657,837 | 9.3% | 4.5% |
| 34 | Monroe | 37.00 | 19,755 | $110,461 | $733,030 | 7.3% | 5.7% |
| 35 | Ridgefield | 39.00 | 13,408 | $116,389 | $665,864 | 5.6% | 6.9% |
| 36 | Mountlake Terrace | 39.50 | 23,104 | $107,687 | $699,079 | 7.0% | 4.2% |
| 37 | Poulsbo | 40.00 | 12,165 | $116,250 | $665,803 | 9.3% | 3.7% |
| 38 | Renton | 41.00 | 105,317 | $100,432 | $764,375 | 8.1% | 4.9% |
| 39 | DuPont | 44.00 | 9,931 | $120,781 | $621,242 | 4.6% | 6.2% |
| 40 | Washougal | 47.00 | 17,490 | $106,368 | $640,872 | 11.2% | 7.7% |
| 41 | Fircrest | 47.50 | 7,069 | $113,926 | $623,545 | 5.7% | 6.8% |
| 42 | Orting | 47.50 | 8,978 | $132,877 | $560,311 | 2.4% | 2.8% |
| 43 | Snohomish | 47.50 | 10,239 | $87,250 | $939,010 | 6.7% | 10.6% |
| 44 | La Center | 48.00 | 3,883 | $101,708 | $660,939 | 5.7% | 3.6% |
| 45 | Anacortes | 48.50 | 17,966 | $91,951 | $725,456 | 7.3% | 4.2% |
| 46 | Marysville | 49.50 | 73,002 | $103,974 | $634,696 | 8.1% | 3.9% |
| 47 | University Place | 49.50 | 34,911 | $99,031 | $661,410 | 8.2% | 5.1% |
| 48 | Lynden | 51.00 | 16,234 | $103,233 | $625,493 | 7.3% | 3.6% |
| 49 | Steilacoom | 51.00 | 6,686 | $100,851 | $640,511 | 11.1% | 6.0% |
| 50 | Stanwood | 51.50 | 8,373 | $90,242 | $715,579 | 8.0% | 6.4% |
| 51 | Battle Ground | 53.00 | 21,886 | $104,977 | $606,387 | 5.9% | 3.7% |
| 52 | Liberty Lake | 53.50 | 12,737 | $118,723 | $558,764 | 5.0% | 2.7% |
| 53 | Pacific | 55.00 | 7,066 | $115,625 | $561,715 | 13.8% | 4.6% |
| 54 | Granite Falls | 55.00 | 4,659 | $105,136 | $585,734 | 3.4% | 2.4% |
| 55 | Kent | 55.50 | 135,603 | $92,302 | $656,314 | 10.8% | 7.0% |
| 56 | Arlington | 55.50 | 21,095 | $88,231 | $669,006 | 12.7% | 4.2% |
| 57 | Burien | 57.00 | 51,513 | $91,318 | $650,469 | 12.9% | 7.0% |
| 58 | Auburn | 57.00 | 85,676 | $97,884 | $614,182 | 8.9% | 6.0% |
| 59 | Sumner | 58.50 | 10,733 | $98,191 | $593,648 | 4.9% | 5.3% |
| 60 | Lynnwood | 60.00 | 40,110 | $77,704 | $784,107 | 14.2% | 4.3% |
| 61 | Des Moines | 60.50 | 32,823 | $92,483 | $612,731 | 12.1% | 7.5% |
| 62 | Everett | 62.00 | 111,845 | $83,512 | $662,786 | 12.9% | 5.8% |
| 63 | Puyallup | 62.50 | 42,746 | $97,826 | $570,442 | 7.0% | 6.0% |
| 64 | West Richland | 62.50 | 17,586 | $119,892 | $493,162 | 8.5% | 4.8% |
| 65 | Milton | 62.50 | 8,894 | $96,540 | $572,123 | 10.2% | 5.3% |
| 66 | Kalama | 65.00 | 3,050 | $102,026 | $536,798 | 13.4% | 1.3% |
| 67 | Sultan | 65.00 | 6,116 | $94,730 | $564,591 | 5.8% | 1.0% |
| 68 | Ferndale | 65.00 | 15,999 | $87,579 | $616,287 | 12.8% | 3.1% |
| 69 | Federal Way | 68.00 | 99,493 | $86,909 | $601,744 | 13.0% | 5.4% |
| 70 | Fife | 71.00 | 10,949 | $90,532 | $557,639 | 11.2% | 5.2% |
| 71 | Tumwater | 72.00 | 26,956 | $95,212 | $526,058 | 7.0% | 5.3% |
| 72 | Port Orchard | 72.50 | 17,149 | $89,795 | $556,428 | 9.7% | 3.9% |
| 73 | Woodland | 73.50 | 6,487 | $81,193 | $589,005 | 12.9% | 1.9% |
| 74 | Lacey | 76.50 | 57,737 | $90,625 | $516,096 | 11.6% | 4.9% |
| 75 | Bellingham | 77.00 | 93,438 | $66,755 | $668,589 | 18.6% | 5.6% |
| 76 | Tukwila | 78.00 | 21,451 | $78,381 | $575,995 | 13.0% | 6.4% |
| 77 | Blaine | 78.00 | 6,100 | $84,030 | $541,720 | 13.1% | 5.5% |
| 78 | Richland | 78.50 | 62,753 | $95,813 | $466,467 | 9.0% | 5.6% |
| 79 | Algona | 79.00 | 3,247 | $85,332 | $538,000 | 12.1% | 9.4% |
| 80 | Yelm | 80.50 | 11,102 | $90,750 | $489,021 | 6.1% | 3.8% |
| 81 | SeaTac | 80.50 | 32,414 | $81,104 | $553,220 | 9.3% | 7.0% |
| 82 | Mount Vernon | 81.00 | 35,377 | $75,777 | $586,879 | 16.1% | 6.0% |
| 83 | Burlington | 82.50 | 10,003 | $80,475 | $539,012 | 14.5% | 4.3% |
| 84 | Olympia | 82.50 | 55,951 | $81,302 | $533,713 | 14.0% | 7.3% |
| 85 | Tacoma | 83.00 | 222,758 | $85,884 | $493,840 | 12.4% | 5.6% |
| 86 | Moxee | 84.00 | 4,625 | $100,512 | $398,716 | 7.8% | 0.8% |
| 87 | Vancouver | 85.00 | 195,300 | $81,338 | $509,318 | 10.2% | 5.7% |
| 88 | Chelan | 86.00 | 4,350 | $82,637 | $493,386 | 8.4% | 1.6% |
| 89 | Sedro-Woolley | 87.50 | 12,831 | $80,885 | $497,458 | 15.7% | 4.8% |
| 90 | Port Townsend | 87.75 | 10,438 | $62,606 | $633,223 | 13.5% | 10.4% |
| 91 | Quincy | 89.50 | 7,998 | $87,902 | $424,717 | 6.2% | 7.7% |
| 92 | Oak Harbor | 90.00 | 24,362 | $76,084 | $528,587 | 8.3% | 5.4% |
| 93 | East Wenatchee | 90.50 | 14,199 | $77,558 | $510,449 | 8.0% | 4.6% |
| 94 | Everson | 90.50 | 3,040 | $80,250 | $491,742 | 5.5% | 2.0% |
| 95 | Lakewood | 94.00 | 62,937 | $74,720 | $521,148 | 13.2% | 5.7% |
| 96 | Pasco | 94.50 | 79,575 | $85,586 | $418,088 | 12.6% | 5.3% |
| 97 | Medical Lake | 97.50 | 4,950 | $79,989 | $426,995 | 8.1% | 1.2% |
| 98 | Bremerton | 98.00 | 44,830 | $74,940 | $483,132 | 13.8% | 5.7% |
| 99 | Cashmere | 98.50 | 3,304 | $64,053 | $538,966 | 7.4% | 0.4% |
| 100 | Sequim | 99.50 | 8,161 | $59,707 | $562,161 | 12.9% | 9.7% |
Source: U.S. Census ACS 2020-2024, Zillow research. 144 cities with more than 3,000 residents.
Clyde Hill is the richest place in Washington for 2026
When we set out to identify the richest places in Washington, we weren’t sure what we’d find, but it ended up being some of the best places to live in the state. The richest cities in Washington are Clyde Hill, Mercer Island, and Sammamish, and when you look at the data they sit at the very top of the income ladder for everyone who lives there.
Breaking into the top ten takes a median household income of at least $160,278. If you’re curious about the other end of the ledger, the poorest places are listed to the right.