Black Diamond SnackAbility
Overall SnackAbility
Crime in Black Diamond summary. We use data from the FBI to determine the crime rates in Black Diamond. Key points include:
There were 31 total crimes in Black Diamond in the last reporting year.
The overall crime rate per 100,000 people in Black Diamond is 422.8 / 100k people.
The violent crime rate per 100,000 people in Black Diamond is 27.3 / 100k people.
The property crime rate per 100,000 people in Black Diamond is 395.5 / 100k people.
Overall, crime in Black Diamond is -80.05% below the national average.
Total Crimes
Below National Average
Crime In Black Diamond Comparison Table
| Statistic | Count Raw |
Black Diamond / 100k People |
Washington / 100k People |
National / 100k People |
|---|---|---|---|---|
| Total Crimes Per 100K | 31 | 422.8 | 2,792.6 | 2,119.2 |
| Violent Crime | 2 | 27.3 | 326.1 | 359.0 |
| Murder | 0 | 0.0 | 3.8 | 5.0 |
| Robbery | 0 | 0.0 | 67.5 | 61.0 |
| Aggravated Assault | 2 | 27.3 | 217.0 | 256.0 |
| Property Crime | 29 | 395.5 | 2,466.5 | 1,760.0 |
| Burglary | 4 | 54.6 | 398.8 | 229.0 |
| Larceny | 19 | 259.1 | 1,634.2 | 1,272.0 |
| Car Theft | 6 | 81.8 | 433.5 | 259.0 |
Source: FBI Uniform Crime Reporting (2024)
Black Diamond, WA Weather
The average high in Black Diamond is 59.4° and the average low is 41.9°.
There are 90.6 days of precipitation each year.
Expect an average of 52.4 inches of precipitation each year with 7.1 inches of snow.
| Stat | Black Diamond |
|---|---|
| Average Annual High | 59.4 |
| Average Annual Low | 41.9 |
| Annual Precipitation Days | 90.6 |
| Average Annual Precipitation | 52.4 |
| Average Annual Snowfall | 7.1 |
Average High
Days of Rain
Source: NOAA climate normals (30-year)
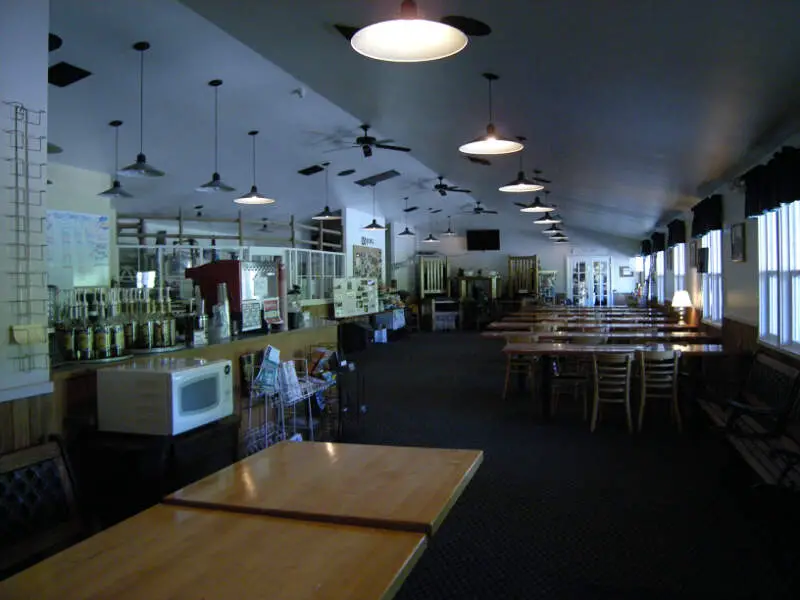
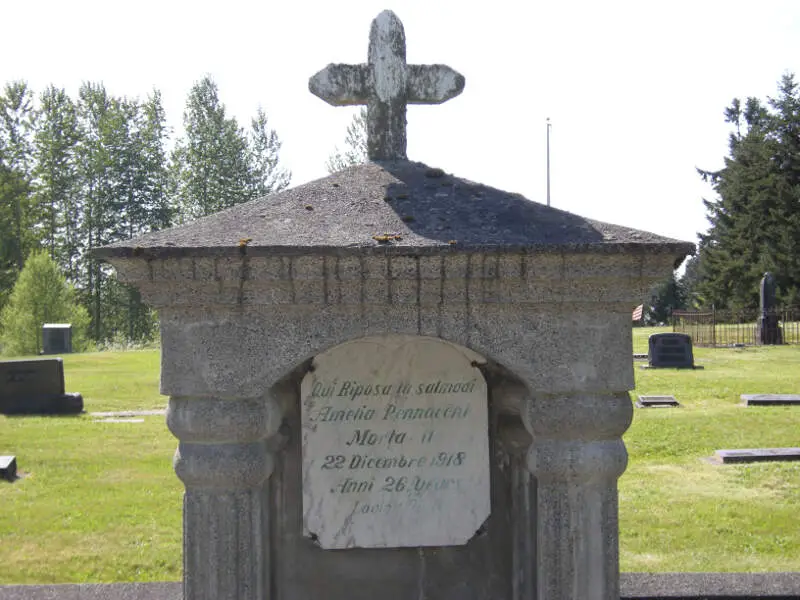
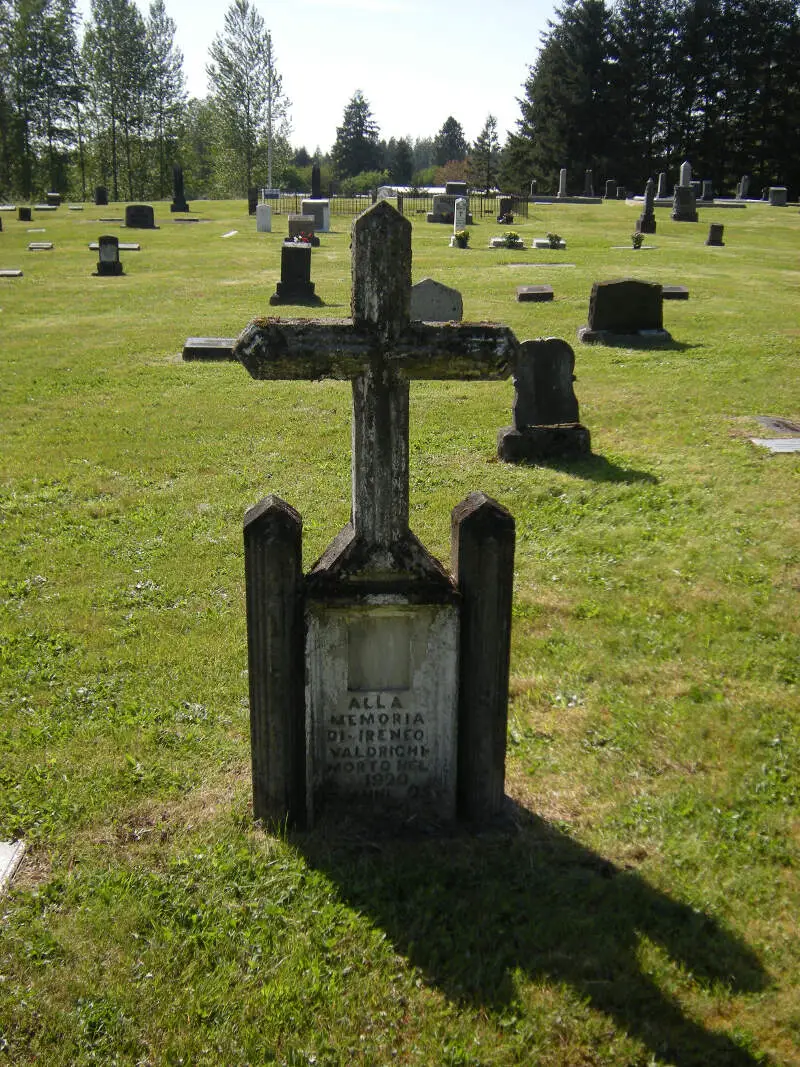
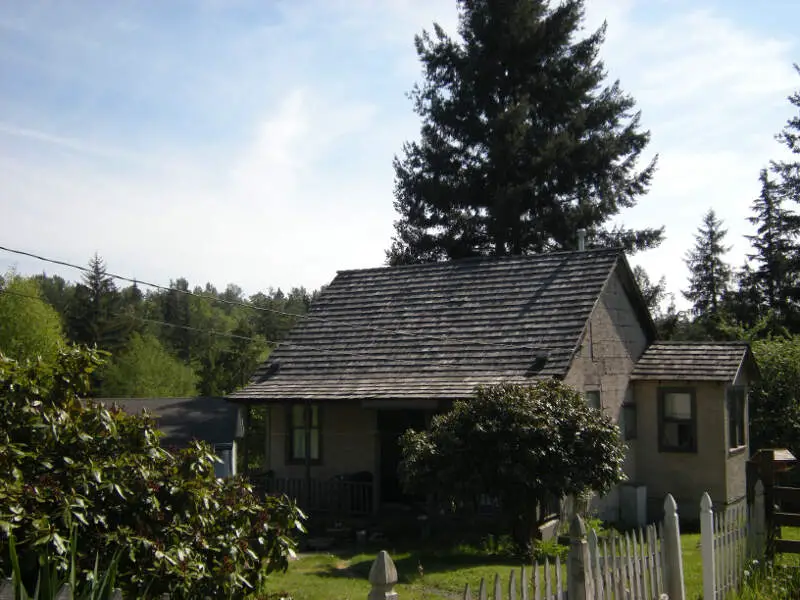
Black Diamond, WA Photos
Rankings & Articles For Black Diamond


Locations Around Black Diamond
Map Of Black Diamond, WA
Best Places Around Black Diamond
Summit View, WA
Population 8,480
Fife, WA
Population 10,949
Sumner, WA
Population 10,733
Puyallup, WA
Population 42,746
Lake Tapps, WA
Population 12,798
Orting, WA
Population 8,978
SeaTac, WA
Population 32,414
Bonney Lake, WA
Population 22,090
Waller, WA
Population 7,683
Milton, WA
Population 8,894
Black Diamond Demographics And Statistics
Population over time in Black Diamond
The current population in Black Diamond is 5,961. The population has increased 46.4% from 2010.
| Year | Population | % Change |
|---|---|---|
| 2024 | 5,961 | 5.0% |
| 2023 | 5,678 | 6.8% |
| 2022 | 5,314 | 6.2% |
| 2021 | 5,002 | 6.4% |
| 2020 | 4,703 | 5.1% |
| 2019 | 4,476 | 0.9% |
| 2018 | 4,434 | 1.3% |
| 2017 | 4,378 | 1.3% |
| 2016 | 4,321 | 0.7% |
| 2015 | 4,291 | 0.8% |
| 2014 | 4,257 | 1.3% |
| 2013 | 4,201 | 0.7% |
| 2012 | 4,170 | 1.2% |
| 2011 | 4,121 | 1.2% |
| 2010 | 4,073 | - |
Race / Ethnicity in Black Diamond
See the full breakdown
Black Diamond is:
67.0% White with 3,996 White residents.
0.4% African American with 24 African American residents.
0.0% American Indian with 0 American Indian residents.
17.6% Asian with 1,051 Asian residents.
0.0% Hawaiian with 0 Hawaiian residents.
0.6% Other with 34 Other residents.
6.4% Two Or More with 384 Two Or More residents.
7.9% Hispanic with 472 Hispanic residents.
| Race | Black Diamond | WA | USA |
|---|---|---|---|
| White | 67.0% | 63.1% | 57.4% |
| African American | 0.4% | 3.8% | 11.9% |
| American Indian | 0.0% | 0.8% | 0.5% |
| Asian | 17.6% | 9.7% | 5.9% |
| Hawaiian | 0.0% | 0.7% | 0.2% |
| Other | 0.6% | 0.6% | 0.6% |
| Two Or More | 6.4% | 6.8% | 4.3% |
| Hispanic | 7.9% | 14.4% | 19.3% |
Gender in Black Diamond
See the full breakdown
Black Diamond is 47.8% female with 2,851 female residents.
Black Diamond is 52.2% male with 3,109 male residents.
| Gender | Black Diamond | WA | USA |
|---|---|---|---|
| Female | 47.8% | 49.6% | 50.5% |
| Male | 52.2% | 50.4% | 49.5% |
Highest level of educational attainment in Black Diamond for adults over 25
See the full breakdown
1.0% of adults in Black Diamond completed < 9th grade.
1.0% of adults in Black Diamond completed 9-12th grade.
15.0% of adults in Black Diamond completed high school / ged.
16.0% of adults in Black Diamond completed some college.
12.0% of adults in Black Diamond completed associate's degree.
37.0% of adults in Black Diamond completed bachelor's degree.
14.0% of adults in Black Diamond completed master's degree.
2.0% of adults in Black Diamond completed professional degree.
2.0% of adults in Black Diamond completed doctorate degree.
| Education | Black Diamond | WA | USA |
|---|---|---|---|
| < 9th Grade | 1.0% | 4.0% | 4.0% |
| 9-12th Grade | 1.0% | 4.0% | 6.0% |
| High School / GED | 15.0% | 22.0% | 26.0% |
| Some College | 16.0% | 21.0% | 19.0% |
| Associate's Degree | 12.0% | 10.0% | 9.0% |
| Bachelor's Degree | 37.0% | 24.0% | 22.0% |
| Master's Degree | 14.0% | 11.0% | 10.0% |
| Professional Degree | 2.0% | 2.0% | 2.0% |
| Doctorate Degree | 2.0% | 2.0% | 2.0% |
Household Income For Black Diamond, Washington
See the full breakdown
0.0% of households in Black Diamond earn Less than $10,000.
0.0% of households in Black Diamond earn $10,000 to $14,999.
2.0% of households in Black Diamond earn $15,000 to $24,999.
1.6% of households in Black Diamond earn $25,000 to $34,999.
5.3% of households in Black Diamond earn $35,000 to $49,999.
6.5% of households in Black Diamond earn $50,000 to $74,999.
9.0% of households in Black Diamond earn $75,000 to $99,999.
30.9% of households in Black Diamond earn $100,000 to $149,999.
14.2% of households in Black Diamond earn $150,000 to $199,999.
30.6% of households in Black Diamond earn $200,000 or more.
| Income | Black Diamond | WA | USA |
|---|---|---|---|
| Less than $10,000 | 0.0% | 3.9% | 5.0% |
| $10,000 to $14,999 | 0.0% | 2.5% | 3.4% |
| $15,000 to $24,999 | 2.0% | 4.6% | 6.3% |
| $25,000 to $34,999 | 1.6% | 5.0% | 6.6% |
| $35,000 to $49,999 | 5.3% | 8.2% | 10.1% |
| $50,000 to $74,999 | 6.5% | 14.1% | 15.5% |
| $75,000 to $99,999 | 9.0% | 12.4% | 12.6% |
| $100,000 to $149,999 | 30.9% | 19.2% | 17.5% |
| $150,000 to $199,999 | 14.2% | 11.4% | 9.6% |
| $200,000 or more | 30.6% | 18.5% | 13.4% |
Source: U.S. Census ACS 5-year estimates (2024)


