Clarkston SnackAbility
Overall SnackAbility
Cost of living in Clarkston summary. We use data on the cost of living to determine how expensive it is to live in Clarkston. Real estate prices drive most of the variance in cost of living around Washington. Key points include:
The cost of living in Clarkston is 96 with 100 being average.
The cost of living in Clarkston is 1.0x lower than the national average.
The median home value in Clarkston is $339,607.
The median income in Clarkston is $54,152.
Clarkston's Overall Cost Of Living
Lower Than The National Average
Cost Of Living In Clarkston Comparison Table
| Living Expense | Clarkston | Washington | National Average |
|---|---|---|---|
| Overall | 96 | 120 | 100 |
| Services | 102 | 108 | 100 |
| Groceries | 103 | 108 | 100 |
| Health | 78 | 137 | 100 |
| Housing | 105 | 111 | 100 |
| Transportation | 105 | 111 | 100 |
| Utilities | 106 | 110 | 100 |
Source: Cost of living index, normalized to US average = 100
Clarkston, WA Weather
The average high in Clarkston is 64.9° and the average low is 42.3°.
There are 49.8 days of precipitation each year.
Expect an average of 12.3 inches of precipitation each year with 15.4 inches of snow.
| Stat | Clarkston |
|---|---|
| Average Annual High | 64.9 |
| Average Annual Low | 42.3 |
| Annual Precipitation Days | 49.8 |
| Average Annual Precipitation | 12.3 |
| Average Annual Snowfall | 15.4 |
Average High
Days of Rain
Source: NOAA climate normals (30-year)
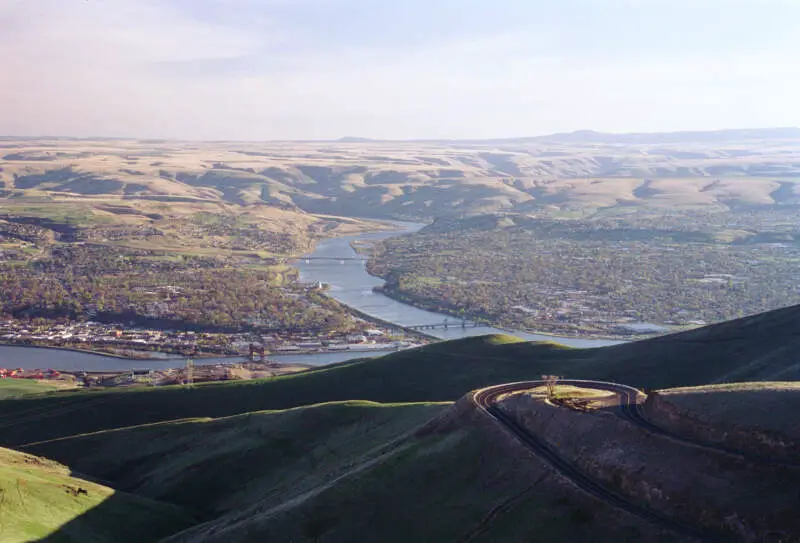
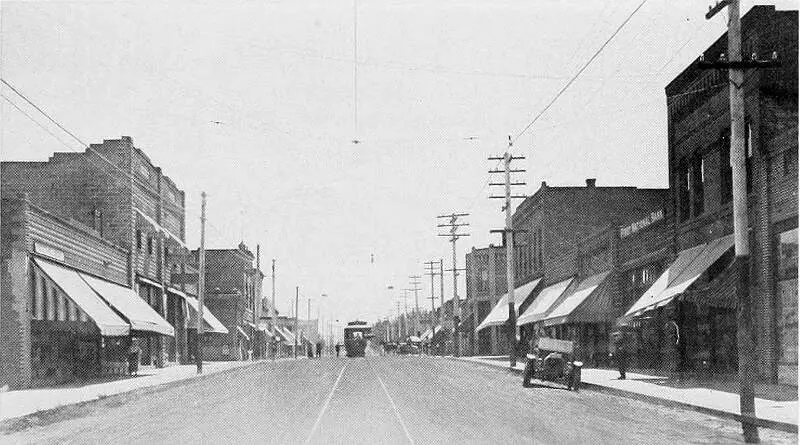
Clarkston, WA Photos
Rankings & Articles For Clarkston


Locations Around Clarkston
Map Of Clarkston, WA
Best Places Around Clarkston
West Clarkston-Highland, WA
Population 5,444
Pullman, WA
Population 32,229
Moscow, ID
Population 26,286
Lewiston, ID
Population 34,651
Clarkston Heights-Vineland, WA
Population 7,884
Clarkston Demographics And Statistics
Population over time in Clarkston
The current population in Clarkston is 7,191. The population has decreased 0.2% from 2010.
| Year | Population | % Change |
|---|---|---|
| 2024 | 7,191 | -0.7% |
| 2023 | 7,240 | 0.2% |
| 2022 | 7,222 | 0.8% |
| 2021 | 7,164 | -3.6% |
| 2020 | 7,435 | 0.7% |
| 2019 | 7,381 | 0.3% |
| 2018 | 7,360 | 0.2% |
| 2017 | 7,344 | 0.4% |
| 2016 | 7,314 | -0.2% |
| 2015 | 7,330 | 0.2% |
| 2014 | 7,318 | 0.4% |
| 2013 | 7,290 | 0.7% |
| 2012 | 7,237 | 0.1% |
| 2011 | 7,227 | 0.3% |
| 2010 | 7,204 | - |
Race / Ethnicity in Clarkston
See the full breakdown
Clarkston is:
81.9% White with 5,888 White residents.
2.3% African American with 165 African American residents.
1.7% American Indian with 119 American Indian residents.
3.4% Asian with 243 Asian residents.
0.0% Hawaiian with 0 Hawaiian residents.
0.2% Other with 14 Other residents.
5.9% Two Or More with 424 Two Or More residents.
4.7% Hispanic with 338 Hispanic residents.
| Race | Clarkston | WA | USA |
|---|---|---|---|
| White | 81.9% | 63.1% | 57.4% |
| African American | 2.3% | 3.8% | 11.9% |
| American Indian | 1.7% | 0.8% | 0.5% |
| Asian | 3.4% | 9.7% | 5.9% |
| Hawaiian | 0.0% | 0.7% | 0.2% |
| Other | 0.2% | 0.6% | 0.6% |
| Two Or More | 5.9% | 6.8% | 4.3% |
| Hispanic | 4.7% | 14.4% | 19.3% |
Gender in Clarkston
See the full breakdown
Clarkston is 53.4% female with 3,843 female residents.
Clarkston is 46.6% male with 3,348 male residents.
| Gender | Clarkston | WA | USA |
|---|---|---|---|
| Female | 53.4% | 49.6% | 50.5% |
| Male | 46.6% | 50.4% | 49.5% |
Highest level of educational attainment in Clarkston for adults over 25
See the full breakdown
2.0% of adults in Clarkston completed < 9th grade.
5.0% of adults in Clarkston completed 9-12th grade.
34.0% of adults in Clarkston completed high school / ged.
29.0% of adults in Clarkston completed some college.
13.0% of adults in Clarkston completed associate's degree.
13.0% of adults in Clarkston completed bachelor's degree.
3.0% of adults in Clarkston completed master's degree.
0.0% of adults in Clarkston completed professional degree.
1.0% of adults in Clarkston completed doctorate degree.
| Education | Clarkston | WA | USA |
|---|---|---|---|
| < 9th Grade | 2.0% | 4.0% | 4.0% |
| 9-12th Grade | 5.0% | 4.0% | 6.0% |
| High School / GED | 34.0% | 22.0% | 26.0% |
| Some College | 29.0% | 21.0% | 19.0% |
| Associate's Degree | 13.0% | 10.0% | 9.0% |
| Bachelor's Degree | 13.0% | 24.0% | 22.0% |
| Master's Degree | 3.0% | 11.0% | 10.0% |
| Professional Degree | 0.0% | 2.0% | 2.0% |
| Doctorate Degree | 1.0% | 2.0% | 2.0% |
Household Income For Clarkston, Washington
See the full breakdown
7.0% of households in Clarkston earn Less than $10,000.
4.1% of households in Clarkston earn $10,000 to $14,999.
8.4% of households in Clarkston earn $15,000 to $24,999.
10.9% of households in Clarkston earn $25,000 to $34,999.
15.6% of households in Clarkston earn $35,000 to $49,999.
16.3% of households in Clarkston earn $50,000 to $74,999.
16.2% of households in Clarkston earn $75,000 to $99,999.
14.0% of households in Clarkston earn $100,000 to $149,999.
4.4% of households in Clarkston earn $150,000 to $199,999.
3.2% of households in Clarkston earn $200,000 or more.
| Income | Clarkston | WA | USA |
|---|---|---|---|
| Less than $10,000 | 7.0% | 3.9% | 5.0% |
| $10,000 to $14,999 | 4.1% | 2.5% | 3.4% |
| $15,000 to $24,999 | 8.4% | 4.6% | 6.3% |
| $25,000 to $34,999 | 10.9% | 5.0% | 6.6% |
| $35,000 to $49,999 | 15.6% | 8.2% | 10.1% |
| $50,000 to $74,999 | 16.3% | 14.1% | 15.5% |
| $75,000 to $99,999 | 16.2% | 12.4% | 12.6% |
| $100,000 to $149,999 | 14.0% | 19.2% | 17.5% |
| $150,000 to $199,999 | 4.4% | 11.4% | 9.6% |
| $200,000 or more | 3.2% | 18.5% | 13.4% |
Source: U.S. Census ACS 5-year estimates (2024)


