Port Angeles SnackAbility
Overall SnackAbility
Crime in Port Angeles summary. We use data from the FBI to determine the crime rates in Port Angeles. Key points include:
There were 614 total crimes in Port Angeles in the last reporting year.
The overall crime rate per 100,000 people in Port Angeles is 3,049.7 / 100k people.
The violent crime rate per 100,000 people in Port Angeles is 566.2 / 100k people.
The property crime rate per 100,000 people in Port Angeles is 2,483.5 / 100k people.
Overall, crime in Port Angeles is 43.91% above the national average.
Total Crimes
Above National Average
Crime In Port Angeles Comparison Table
| Statistic | Count Raw |
Port Angeles / 100k People |
Washington / 100k People |
National / 100k People |
|---|---|---|---|---|
| Total Crimes Per 100K | 614 | 3,049.7 | 2,792.6 | 2,119.2 |
| Violent Crime | 114 | 566.2 | 326.1 | 359.0 |
| Murder | 2 | 9.9 | 3.8 | 5.0 |
| Robbery | 10 | 49.7 | 67.5 | 61.0 |
| Aggravated Assault | 79 | 392.4 | 217.0 | 256.0 |
| Property Crime | 500 | 2,483.5 | 2,466.5 | 1,760.0 |
| Burglary | 103 | 511.6 | 398.8 | 229.0 |
| Larceny | 350 | 1,738.4 | 1,634.2 | 1,272.0 |
| Car Theft | 47 | 233.4 | 433.5 | 259.0 |
Source: FBI Uniform Crime Reporting (2024)
Cost of living in Port Angeles summary. We use data on the cost of living to determine how expensive it is to live in Port Angeles. Real estate prices drive most of the variance in cost of living around Washington. Key points include:
The cost of living in Port Angeles is 113 with 100 being average.
The cost of living in Port Angeles is 1.1x higher than the national average.
The median home value in Port Angeles is $450,576.
The median income in Port Angeles is $62,606.
Port Angeles's Overall Cost Of Living
Higher Than The National Average
Cost Of Living In Port Angeles Comparison Table
| Living Expense | Port Angeles | Washington | National Average |
|---|---|---|---|
| Overall | 113 | 120 | 100 |
| Services | 106 | 108 | 100 |
| Groceries | 107 | 108 | 100 |
| Health | 121 | 137 | 100 |
| Housing | 110 | 111 | 100 |
| Transportation | 109 | 111 | 100 |
| Utilities | 107 | 110 | 100 |
Source: Cost of living index, normalized to US average = 100
Port Angeles, WA Weather
The average high in Port Angeles is 56.0° and the average low is 42.7°.
There are 82.4 days of precipitation each year.
Expect an average of 28.7 inches of precipitation each year with 4.0 inches of snow.
| Stat | Port Angeles |
|---|---|
| Average Annual High | 56.0 |
| Average Annual Low | 42.7 |
| Annual Precipitation Days | 82.4 |
| Average Annual Precipitation | 28.7 |
| Average Annual Snowfall | 4.0 |
Average High
Days of Rain
Source: NOAA climate normals (30-year)
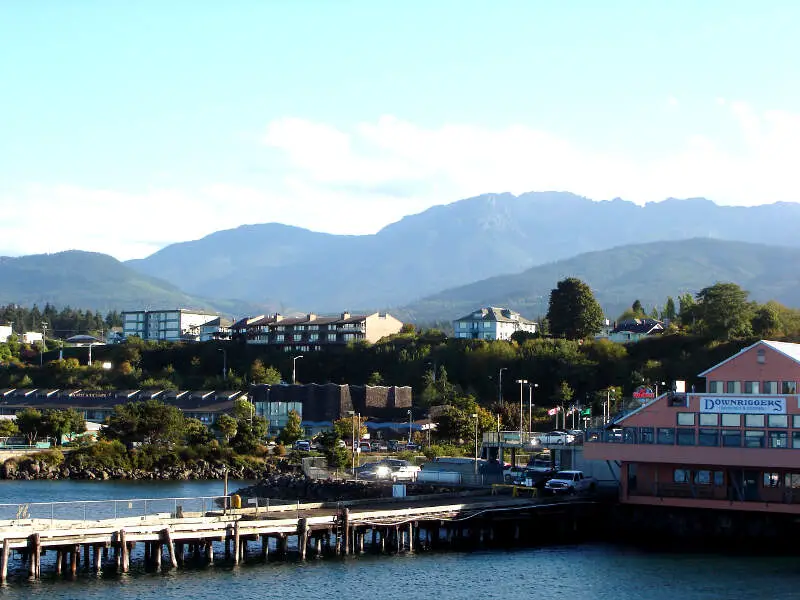
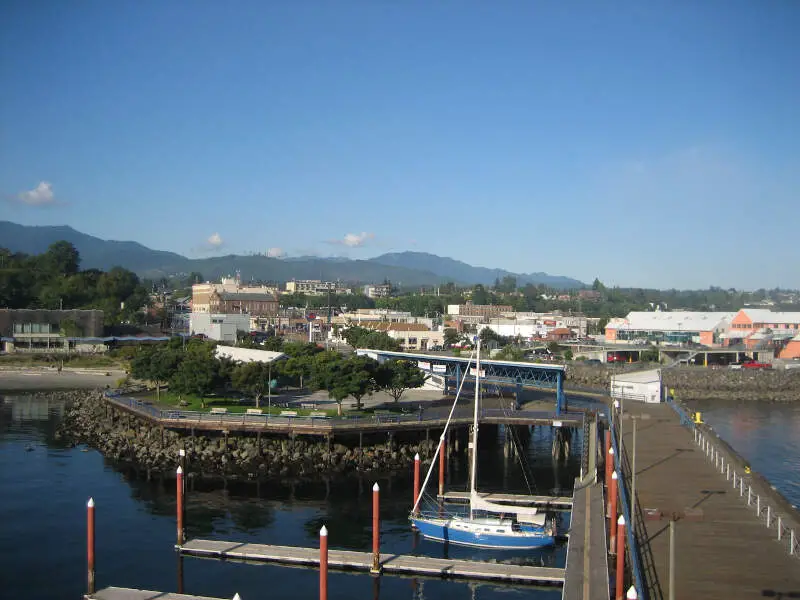
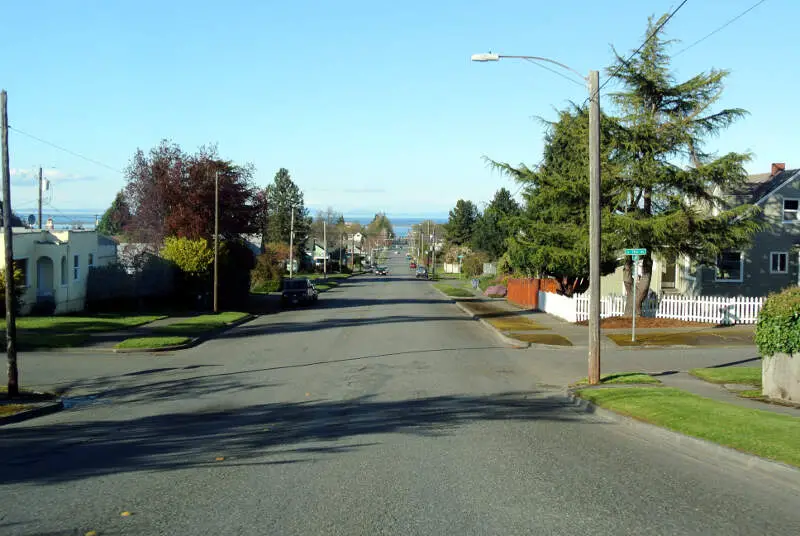
Port Angeles, WA Photos
1 Reviews & Comments About Port Angeles

Port Angeles is a beautiful area with a really bad drug problem. The crime here is as bad as in the big city. The schools are mediocre at best, however high schoolers do have an opportunity to attend the local community college at a reduced rate- making it possible to graduate high school with their AA degree.
The nature around us is hard to beat. We've got sea at our toes and the mountains at our backs. We have both Washington and National parks here. The camping and hiking are divine.
Favorite places are the Olympic National Park, Lake Crescent and Lake Sutherland.
Never leave anything of value in your car! Always lock everything up, don't even trust your hotel maid!
Rankings & Articles For Port Angeles


Locations Around Port Angeles
Map Of Port Angeles, WA
Best Places Around Port Angeles
Sequim, WA
Population 8,161
Port Townsend, WA
Population 10,438
Bangor Base, WA
Population 6,112
Poulsbo, WA
Population 12,165
Anacortes, WA
Population 17,966
Silverdale, WA
Population 20,685
Oak Harbor, WA
Population 24,362
Port Angeles Demographics And Statistics
Population over time in Port Angeles
The current population in Port Angeles is 20,118. The population has increased 5.5% from 2010.
| Year | Population | % Change |
|---|---|---|
| 2024 | 20,118 | 0.2% |
| 2023 | 20,087 | 0.4% |
| 2022 | 20,007 | 0.6% |
| 2021 | 19,888 | -0.9% |
| 2020 | 20,071 | 1.2% |
| 2019 | 19,832 | 1.1% |
| 2018 | 19,615 | 1.0% |
| 2017 | 19,419 | -0.0% |
| 2016 | 19,420 | 1.1% |
| 2015 | 19,200 | 0.4% |
| 2014 | 19,125 | 0.1% |
| 2013 | 19,099 | 0.2% |
| 2012 | 19,061 | -0.2% |
| 2011 | 19,100 | 0.1% |
| 2010 | 19,073 | - |
Race / Ethnicity in Port Angeles
See the full breakdown
Port Angeles is:
78.8% White with 15,843 White residents.
0.9% African American with 187 African American residents.
2.4% American Indian with 487 American Indian residents.
0.8% Asian with 170 Asian residents.
0.0% Hawaiian with 0 Hawaiian residents.
0.2% Other with 37 Other residents.
7.6% Two Or More with 1,524 Two Or More residents.
9.3% Hispanic with 1,870 Hispanic residents.
| Race | Port Angeles | WA | USA |
|---|---|---|---|
| White | 78.8% | 63.1% | 57.4% |
| African American | 0.9% | 3.8% | 11.9% |
| American Indian | 2.4% | 0.8% | 0.5% |
| Asian | 0.8% | 9.7% | 5.9% |
| Hawaiian | 0.0% | 0.7% | 0.2% |
| Other | 0.2% | 0.6% | 0.6% |
| Two Or More | 7.6% | 6.8% | 4.3% |
| Hispanic | 9.3% | 14.4% | 19.3% |
Gender in Port Angeles
See the full breakdown
Port Angeles is 50.5% female with 10,164 female residents.
Port Angeles is 49.5% male with 9,954 male residents.
| Gender | Port Angeles | WA | USA |
|---|---|---|---|
| Female | 50.5% | 49.6% | 50.5% |
| Male | 49.5% | 50.4% | 49.5% |
Highest level of educational attainment in Port Angeles for adults over 25
See the full breakdown
2.0% of adults in Port Angeles completed < 9th grade.
5.0% of adults in Port Angeles completed 9-12th grade.
23.0% of adults in Port Angeles completed high school / ged.
25.0% of adults in Port Angeles completed some college.
15.0% of adults in Port Angeles completed associate's degree.
17.0% of adults in Port Angeles completed bachelor's degree.
9.0% of adults in Port Angeles completed master's degree.
2.0% of adults in Port Angeles completed professional degree.
2.0% of adults in Port Angeles completed doctorate degree.
| Education | Port Angeles | WA | USA |
|---|---|---|---|
| < 9th Grade | 2.0% | 4.0% | 4.0% |
| 9-12th Grade | 5.0% | 4.0% | 6.0% |
| High School / GED | 23.0% | 22.0% | 26.0% |
| Some College | 25.0% | 21.0% | 19.0% |
| Associate's Degree | 15.0% | 10.0% | 9.0% |
| Bachelor's Degree | 17.0% | 24.0% | 22.0% |
| Master's Degree | 9.0% | 11.0% | 10.0% |
| Professional Degree | 2.0% | 2.0% | 2.0% |
| Doctorate Degree | 2.0% | 2.0% | 2.0% |
Household Income For Port Angeles, Washington
See the full breakdown
5.1% of households in Port Angeles earn Less than $10,000.
4.0% of households in Port Angeles earn $10,000 to $14,999.
9.6% of households in Port Angeles earn $15,000 to $24,999.
9.7% of households in Port Angeles earn $25,000 to $34,999.
13.6% of households in Port Angeles earn $35,000 to $49,999.
17.9% of households in Port Angeles earn $50,000 to $74,999.
14.0% of households in Port Angeles earn $75,000 to $99,999.
13.6% of households in Port Angeles earn $100,000 to $149,999.
6.3% of households in Port Angeles earn $150,000 to $199,999.
6.1% of households in Port Angeles earn $200,000 or more.
| Income | Port Angeles | WA | USA |
|---|---|---|---|
| Less than $10,000 | 5.1% | 3.9% | 5.0% |
| $10,000 to $14,999 | 4.0% | 2.5% | 3.4% |
| $15,000 to $24,999 | 9.6% | 4.6% | 6.3% |
| $25,000 to $34,999 | 9.7% | 5.0% | 6.6% |
| $35,000 to $49,999 | 13.6% | 8.2% | 10.1% |
| $50,000 to $74,999 | 17.9% | 14.1% | 15.5% |
| $75,000 to $99,999 | 14.0% | 12.4% | 12.6% |
| $100,000 to $149,999 | 13.6% | 19.2% | 17.5% |
| $150,000 to $199,999 | 6.3% | 11.4% | 9.6% |
| $200,000 or more | 6.1% | 18.5% | 13.4% |
Source: U.S. Census ACS 5-year estimates (2024)


