Richland SnackAbility
Overall SnackAbility
Crime in Richland summary. We use data from the FBI to determine the crime rates in Richland. Key points include:
There were 1,418 total crimes in Richland in the last reporting year.
The overall crime rate per 100,000 people in Richland is 2,190.4 / 100k people.
The violent crime rate per 100,000 people in Richland is 250.2 / 100k people.
The property crime rate per 100,000 people in Richland is 1,940.2 / 100k people.
Overall, crime in Richland is 3.36% above the national average.
Total Crimes
Above National Average
Crime In Richland Comparison Table
| Statistic | Count Raw |
Richland / 100k People |
Washington / 100k People |
National / 100k People |
|---|---|---|---|---|
| Total Crimes Per 100K | 1,418 | 2,190.4 | 2,792.6 | 2,119.2 |
| Violent Crime | 162 | 250.2 | 326.1 | 359.0 |
| Murder | 1 | 1.5 | 3.8 | 5.0 |
| Robbery | 21 | 32.4 | 67.5 | 61.0 |
| Aggravated Assault | 100 | 154.5 | 217.0 | 256.0 |
| Property Crime | 1,256 | 1,940.2 | 2,466.5 | 1,760.0 |
| Burglary | 151 | 233.3 | 398.8 | 229.0 |
| Larceny | 927 | 1,432.0 | 1,634.2 | 1,272.0 |
| Car Theft | 178 | 275.0 | 433.5 | 259.0 |
Source: FBI Uniform Crime Reporting (2024)
Cost of living in Richland summary. We use data on the cost of living to determine how expensive it is to live in Richland. Real estate prices drive most of the variance in cost of living around Washington. Key points include:
The cost of living in Richland is 121 with 100 being average.
The cost of living in Richland is 1.2x higher than the national average.
The median home value in Richland is $466,467.
The median income in Richland is $95,813.
Richland's Overall Cost Of Living
Higher Than The National Average
Cost Of Living In Richland Comparison Table
| Living Expense | Richland | Washington | National Average |
|---|---|---|---|
| Overall | 121 | 120 | 100 |
| Services | 109 | 108 | 100 |
| Groceries | 110 | 108 | 100 |
| Health | 148 | 137 | 100 |
| Housing | 109 | 111 | 100 |
| Transportation | 109 | 111 | 100 |
| Utilities | 107 | 110 | 100 |
Source: Cost of living index, normalized to US average = 100
Richland, WA Weather
The average high in Richland is 65.2° and the average low is 41.8°.
There are 28.2 days of precipitation each year.
Expect an average of 7.7 inches of precipitation each year with 5.0 inches of snow.
| Stat | Richland |
|---|---|
| Average Annual High | 65.2 |
| Average Annual Low | 41.8 |
| Annual Precipitation Days | 28.2 |
| Average Annual Precipitation | 7.7 |
| Average Annual Snowfall | 5.0 |
Average High
Days of Rain
Source: NOAA climate normals (30-year)
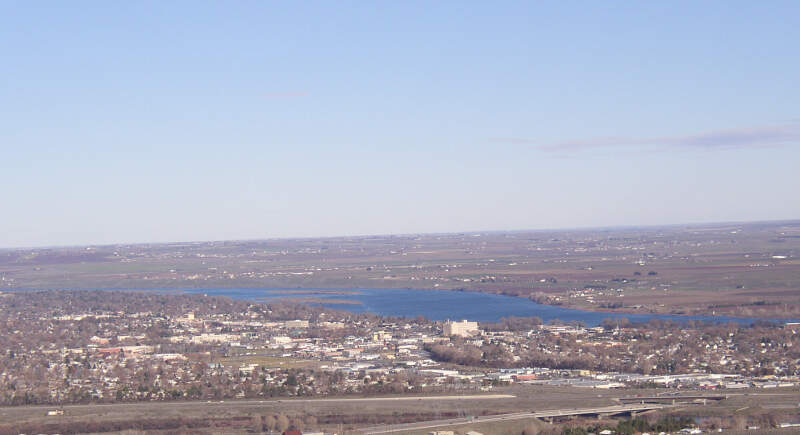
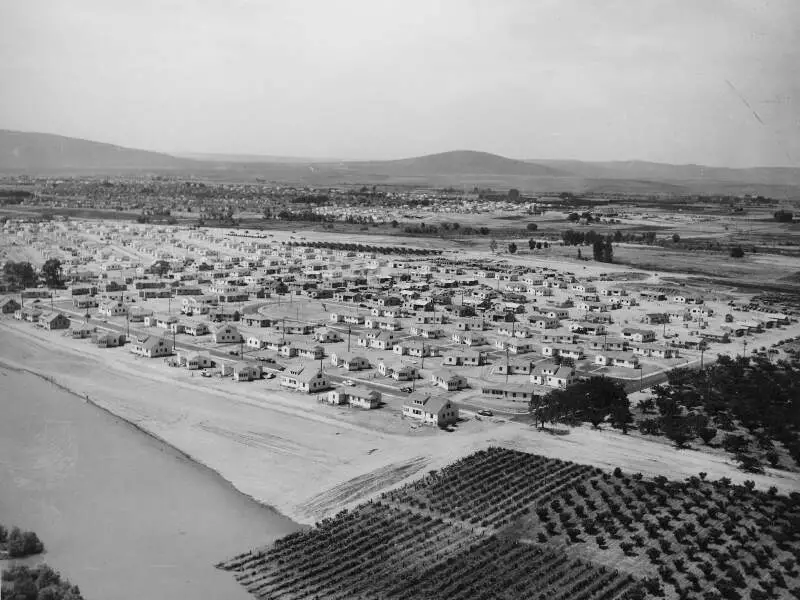
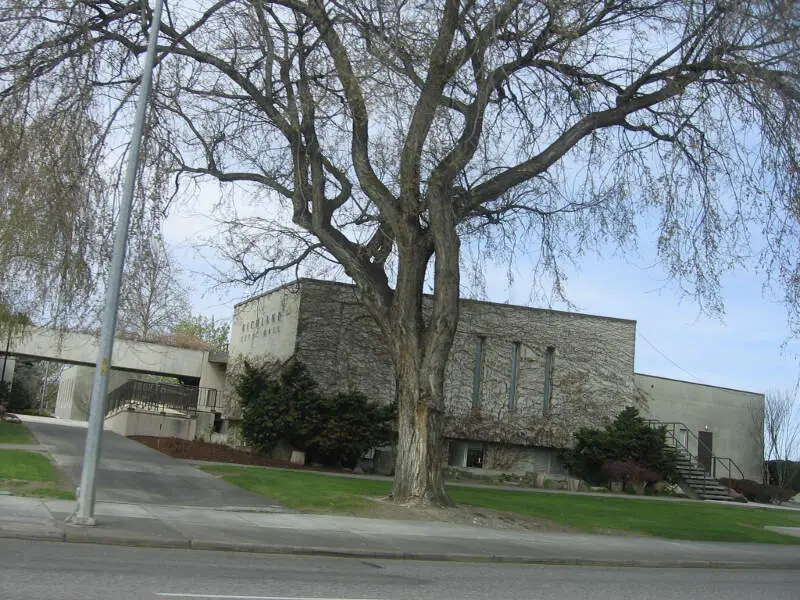
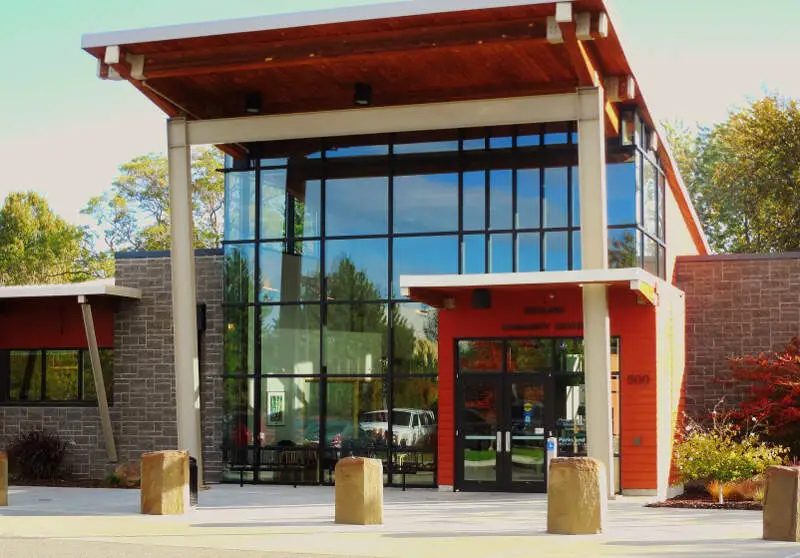
Richland, WA Photos
Rankings & Articles For Richland


Locations Around Richland
Map Of Richland, WA
Best Places Around Richland
Walla Walla, WA
Population 33,925
Finley, WA
Population 5,634
Kennewick, WA
Population 85,295
Sunnyside, WA
Population 16,277
Grandview, WA
Population 11,187
Pasco, WA
Population 79,575
Toppenish, WA
Population 8,723
Hermiston, OR
Population 19,546
Umatilla, OR
Population 7,508
Pendleton, OR
Population 16,950
Richland Demographics And Statistics
Population over time in Richland
The current population in Richland is 62,753. The population has increased 37.1% from 2010.
| Year | Population | % Change |
|---|---|---|
| 2024 | 62,753 | 1.4% |
| 2023 | 61,912 | 1.7% |
| 2022 | 60,867 | 1.9% |
| 2021 | 59,718 | 4.1% |
| 2020 | 57,353 | 1.7% |
| 2019 | 56,399 | 2.5% |
| 2018 | 55,043 | 1.9% |
| 2017 | 53,991 | 1.4% |
| 2016 | 53,227 | 1.8% |
| 2015 | 52,291 | 2.3% |
| 2014 | 51,116 | 2.4% |
| 2013 | 49,933 | 2.8% |
| 2012 | 48,556 | 3.4% |
| 2011 | 46,945 | 2.5% |
| 2010 | 45,780 | - |
Race / Ethnicity in Richland
See the full breakdown
Richland is:
72.2% White with 45,321 White residents.
1.0% African American with 656 African American residents.
0.1% American Indian with 89 American Indian residents.
6.4% Asian with 3,995 Asian residents.
0.3% Hawaiian with 159 Hawaiian residents.
0.7% Other with 459 Other residents.
4.4% Two Or More with 2,765 Two Or More residents.
14.8% Hispanic with 9,309 Hispanic residents.
| Race | Richland | WA | USA |
|---|---|---|---|
| White | 72.2% | 63.1% | 57.4% |
| African American | 1.0% | 3.8% | 11.9% |
| American Indian | 0.1% | 0.8% | 0.5% |
| Asian | 6.4% | 9.7% | 5.9% |
| Hawaiian | 0.3% | 0.7% | 0.2% |
| Other | 0.7% | 0.6% | 0.6% |
| Two Or More | 4.4% | 6.8% | 4.3% |
| Hispanic | 14.8% | 14.4% | 19.3% |
Gender in Richland
See the full breakdown
Richland is 48.7% female with 30,585 female residents.
Richland is 51.3% male with 32,167 male residents.
| Gender | Richland | WA | USA |
|---|---|---|---|
| Female | 48.7% | 49.6% | 50.5% |
| Male | 51.3% | 50.4% | 49.5% |
Highest level of educational attainment in Richland for adults over 25
See the full breakdown
2.0% of adults in Richland completed < 9th grade.
3.0% of adults in Richland completed 9-12th grade.
17.0% of adults in Richland completed high school / ged.
21.0% of adults in Richland completed some college.
10.0% of adults in Richland completed associate's degree.
26.0% of adults in Richland completed bachelor's degree.
13.0% of adults in Richland completed master's degree.
3.0% of adults in Richland completed professional degree.
5.0% of adults in Richland completed doctorate degree.
| Education | Richland | WA | USA |
|---|---|---|---|
| < 9th Grade | 2.0% | 4.0% | 4.0% |
| 9-12th Grade | 3.0% | 4.0% | 6.0% |
| High School / GED | 17.0% | 22.0% | 26.0% |
| Some College | 21.0% | 21.0% | 19.0% |
| Associate's Degree | 10.0% | 10.0% | 9.0% |
| Bachelor's Degree | 26.0% | 24.0% | 22.0% |
| Master's Degree | 13.0% | 11.0% | 10.0% |
| Professional Degree | 3.0% | 2.0% | 2.0% |
| Doctorate Degree | 5.0% | 2.0% | 2.0% |
Household Income For Richland, Washington
See the full breakdown
3.2% of households in Richland earn Less than $10,000.
1.7% of households in Richland earn $10,000 to $14,999.
5.0% of households in Richland earn $15,000 to $24,999.
4.6% of households in Richland earn $25,000 to $34,999.
7.8% of households in Richland earn $35,000 to $49,999.
13.4% of households in Richland earn $50,000 to $74,999.
16.9% of households in Richland earn $75,000 to $99,999.
18.2% of households in Richland earn $100,000 to $149,999.
13.1% of households in Richland earn $150,000 to $199,999.
16.3% of households in Richland earn $200,000 or more.
| Income | Richland | WA | USA |
|---|---|---|---|
| Less than $10,000 | 3.2% | 3.9% | 5.0% |
| $10,000 to $14,999 | 1.7% | 2.5% | 3.4% |
| $15,000 to $24,999 | 5.0% | 4.6% | 6.3% |
| $25,000 to $34,999 | 4.6% | 5.0% | 6.6% |
| $35,000 to $49,999 | 7.8% | 8.2% | 10.1% |
| $50,000 to $74,999 | 13.4% | 14.1% | 15.5% |
| $75,000 to $99,999 | 16.9% | 12.4% | 12.6% |
| $100,000 to $149,999 | 18.2% | 19.2% | 17.5% |
| $150,000 to $199,999 | 13.1% | 11.4% | 9.6% |
| $200,000 or more | 16.3% | 18.5% | 13.4% |
Source: U.S. Census ACS 5-year estimates (2024)


