Whitest cities in New Jersey research summary. We analyzed New Jersey’s most recent Census data to determine the whitest cities in New Jersey based on the percentage of White residents.
96.1% White · #1 whitest in New Jersey
Little Silver is a borough in Monmouth County, New Jersey, United States. As of the 2010 United States Census, the borough’s population was 5,950, a drop of 220 from the 6,170 counted in the 2000 Census, which had in turn increased by 449 from the 5,721 counted in the 1990 Census.
Data | Crime | Cost of living | Movers
93.0% White · #2 whitest in New Jersey
Fair Haven is a borough in Monmouth County, New Jersey, along the Navesink River and is part of the New York Metropolitan Area. Fair Haven is located on the Rumson peninsula and is bordered by Red Bank and Little Silver to the west. As of the 2010 United States Census, the borough’s population was 6,121, reflecting an increase of 184 from the 5,937 counted in the 2000 Census, which had in turn increased by 667 from the 5,270 counted in the 1990 Census.
Data | Crime | Cost of living | Movers
92.3% White · #3 whitest in New Jersey
Data | Crime | Cost of living | Movers
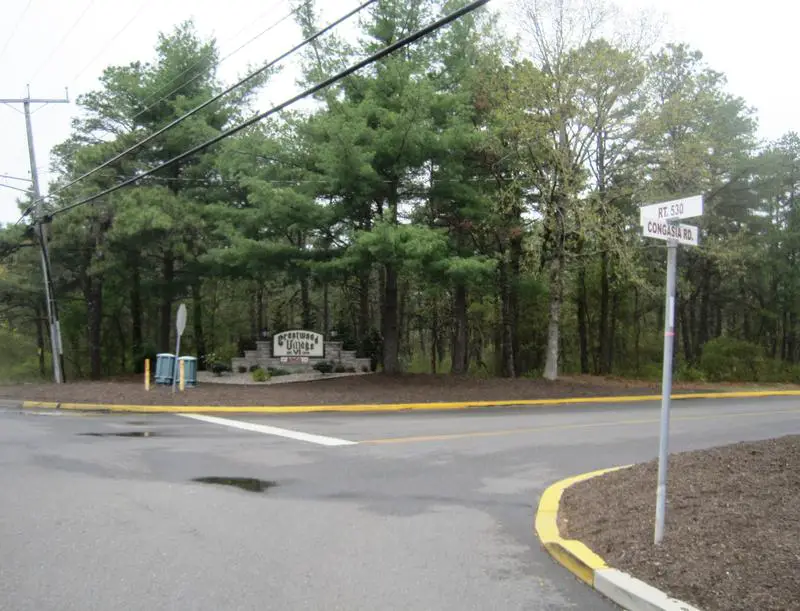
92.0% White · #4 whitest in New Jersey
Data | Crime | Cost of living | Movers
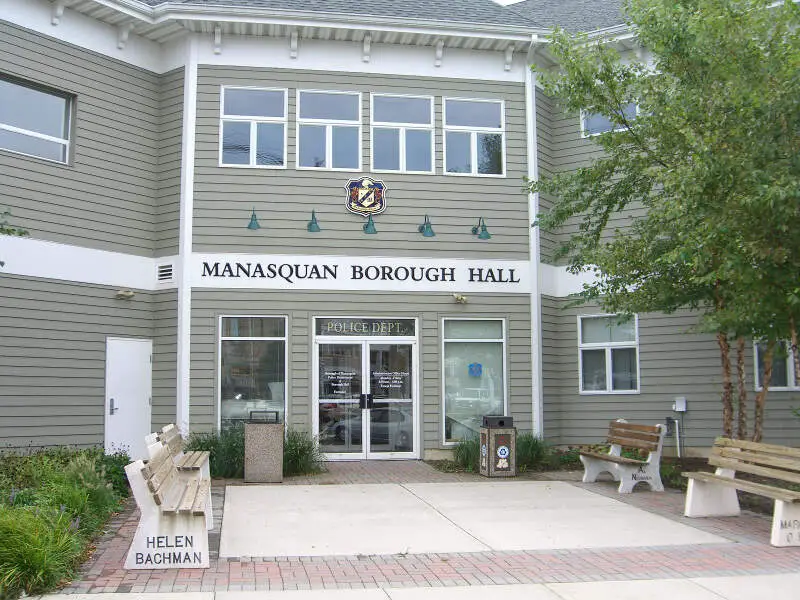
91.3% White · #5 whitest in New Jersey
Data | Crime | Cost of living | Movers
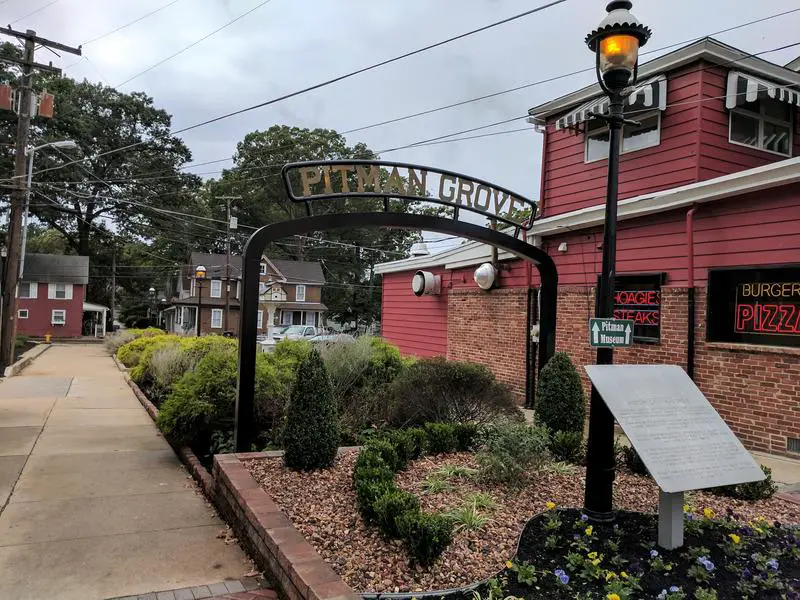
90.0% White · #6 whitest in New Jersey
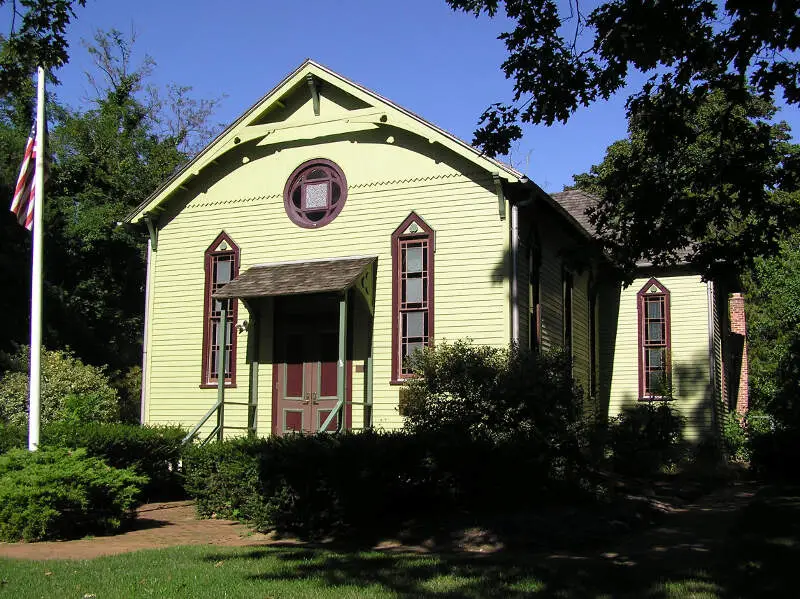
Pitman is a borough in Gloucester County, New Jersey, United States. As of the 2010 United States Census, the borough’s population was 9,011, reflecting a decline of 320 from the 9,331 counted in the 2000 Census, which had in turn declined by 34 from the 9,365 counted in the 1990 Census. The borough was named for Rev. Charles Pitman, a Methodist minister.
Data | Crime | Cost of living | Movers
89.7% White · #7 whitest in New Jersey
Data | Crime | Cost of living | Movers
89.5% White · #8 whitest in New Jersey
Haddon Heights is a borough in Camden County, New Jersey, United States. As of the 2010 United States Census, the borough’s population was 7,473, reflecting a decline of 74 from the 7,547 counted in the 2000 Census, which had in turn declined by 313 from the 7,860 counted in the 1990 Census.
Data | Crime | Cost of living | Movers
89.4% White · #9 whitest in New Jersey
Rumson is a borough in Monmouth County, New Jersey, United States and is part of the New York Metropolitan Area. As of the 2010 census, the borough’s population was 7,122, reflecting a decline of 15 from 7,137 in 2000, which had in turn increased by 436 from 6,701 in 1990.
Data | Crime | Cost of living | Movers
89.3% White · #10 whitest in New Jersey
Data | Crime | Cost of living | Movers
The receipts
Compare the top ten
Pick a metric. The bars rescale. The red line is New Jersey’s statewide median.
On the map
Where New Jersey’s White population is concentrated
Saturday Night Science
Methodology: How we determined the whitest places in New Jersey for 2026
To rank the whitest places in New Jersey, we used Saturday Night Science to look at Census demographic data.
We had to look at the number of white people living in each city in New Jersey on a per capita basis. In other words, the percentage of white people living in each city in New Jersey.
We looked at table B03002: Hispanic OR LATINO ORIGIN BY RACE. Here are the category names as defined by the Census:
- Hispanic or Latino
- White alone*
- Black or African American alone*
- American Indian and Alaska Native alone*
- Asian alone*
- Native Hawaiian and Other Pacific Islander alone*
- Some other race alone*
- Two or more races*
Our particular column of interest here was the number of people who identified as White alone.
We limited our analysis to places with a population greater than 5,000 people. That left us with 251 cities.
We then calculated the percentage of residents that are White. The percentages ranked from 96.1% to 1.9%.
Finally, we ranked each city based on the percentage of the White population, with a higher percentage being more White. Little Silver took the distinction of being the most White, while East Orange was the least White city.
We updated this article for 2026. This report represents our eleventh time ranking the whitest cities in New Jersey.
The full plate
Cities In New Jersey By White Population
Click any column to sort. Search by city name.
| Rank | City | Population | White Population | % White |
|---|---|---|---|---|
| 1 | Little Silver | 6,105 | 5,867 | 96.1% |
| 2 | Fair Haven | 6,170 | 5,740 | 93.0% |
| 3 | Margate City | 5,234 | 4,830 | 92.3% |
| 4 | Crestwood Village | 7,830 | 7,207 | 92.0% |
| 5 | Manasquan | 5,922 | 5,404 | 91.3% |
| 6 | Pitman | 8,856 | 7,972 | 90.0% |
| 7 | Villas | 9,735 | 8,731 | 89.7% |
| 8 | Haddon Heights | 7,516 | 6,728 | 89.5% |
| 9 | Rumson | 7,241 | 6,477 | 89.4% |
| 10 | Audubon | 8,730 | 7,798 | 89.3% |
| 11 | Oceanport | 6,195 | 5,508 | 88.9% |
| 12 | East Freehold | 5,096 | 4,525 | 88.8% |
| 13 | Point Pleasant | 19,334 | 17,054 | 88.2% |
| 14 | Ocean Acres | 19,204 | 16,787 | 87.4% |
| 15 | Haddonfield | 12,595 | 10,916 | 86.7% |
| 16 | Holiday City-Berkeley | 12,995 | 11,218 | 86.3% |
| 17 | Barrington | 7,076 | 6,098 | 86.2% |
| 18 | Yorketown | 7,261 | 6,183 | 85.2% |
| 19 | Bernardsville | 7,916 | 6,729 | 85.0% |
| 20 | Brigantine | 7,674 | 6,523 | 85.0% |
| 21 | Pennsville | 12,233 | 10,329 | 84.4% |
| 22 | Ocean City | 11,261 | 9,505 | 84.4% |
| 23 | Mystic Island | 8,259 | 6,959 | 84.3% |
| 24 | Kinnelon | 10,013 | 8,432 | 84.2% |
| 25 | Lake Mohawk | 9,508 | 7,969 | 83.8% |
| 26 | Linwood | 6,992 | 5,822 | 83.3% |
| 27 | Midland Park | 7,019 | 5,819 | 82.9% |
| 28 | Belmar | 5,869 | 4,844 | 82.5% |
| 29 | Lakewood | 69,585 | 57,161 | 82.1% |
| 30 | Strathmore | 6,708 | 5,485 | 81.8% |
| 31 | Cape May Court House | 5,628 | 4,590 | 81.6% |
| 32 | Ringwood | 11,657 | 9,455 | 81.1% |
| 33 | Morris Plains | 6,315 | 5,083 | 80.5% |
| 34 | Lincroft | 6,939 | 5,561 | 80.1% |
| 35 | Hamilton Square | 11,622 | 9,292 | 80.0% |
| 36 | North Caldwell | 6,656 | 5,306 | 79.7% |
| 37 | Ramblewood | 6,611 | 5,232 | 79.1% |
| 38 | Beachwood | 11,088 | 8,745 | 78.9% |
| 39 | Hillsdale | 10,144 | 7,999 | 78.9% |
| 40 | Moorestown-Lenola | 14,625 | 11,494 | 78.6% |
| 41 | Chatham | 9,407 | 7,377 | 78.4% |
| 42 | Mil | 7,059 | 5,514 | 78.1% |
| 43 | Succasunna | 9,799 | 7,645 | 78.0% |
| 44 | Park Ridge | 9,406 | 7,331 | 77.9% |
| 45 | Oakland | 12,768 | 9,912 | 77.6% |
| 46 | Ashland | 9,320 | 7,222 | 77.5% |
| 47 | White Meadow Lake | 8,842 | 6,826 | 77.2% |
| 48 | Tinton Falls | 19,361 | 14,924 | 77.1% |
| 49 | West Long Branch | 8,586 | 6,605 | 76.9% |
| 50 | Williamstown | 14,705 | 11,299 | 76.8% |
| 51 | Marlton | 10,922 | 8,392 | 76.8% |
| 52 | Westfield | 31,111 | 23,786 | 76.5% |
| 53 | Collingswood | 14,205 | 10,842 | 76.3% |
| 54 | Union Beach | 5,707 | 4,355 | 76.3% |
| 55 | Northfield | 8,456 | 6,450 | 76.3% |
| 56 | Toms River | 94,956 | 71,575 | 75.4% |
| 57 | Glen Rock | 12,154 | 9,129 | 75.1% |
| 58 | Oradell | 8,235 | 6,168 | 74.9% |
| 59 | Upper Montclair | 12,457 | 9,316 | 74.8% |
| 60 | Waldwick | 10,164 | 7,589 | 74.7% |
| 61 | Spotswood | 8,171 | 6,071 | 74.3% |
| 62 | Glen Ridge | 7,943 | 5,896 | 74.2% |
| 63 | Upper Saddle River | 8,439 | 6,254 | 74.1% |
| 64 | West Freehold | 14,883 | 10,961 | 73.6% |
| 65 | Runnemede | 8,355 | 6,137 | 73.5% |
| 66 | Madison | 16,447 | 12,071 | 73.4% |
| 67 | Allendale | 6,865 | 5,020 | 73.1% |
| 68 | Yardville | 6,301 | 4,602 | 73.0% |
| 69 | Pompton Lakes | 11,047 | 8,062 | 73.0% |
| 70 | Newton | 8,369 | 6,085 | 72.7% |
| 71 | Woodcliff Lake | 6,152 | 4,466 | 72.6% |
| 72 | Robertsville | 12,035 | 8,732 | 72.6% |
| 73 | Bloomingdale | 7,716 | 5,596 | 72.5% |
| 74 | Stratford | 7,018 | 5,084 | 72.4% |
| 75 | Ramtown | 6,203 | 4,484 | 72.3% |
| 76 | Lincoln Park | 10,957 | 7,853 | 71.7% |
| 77 | Mountainside | 7,049 | 5,029 | 71.3% |
| 78 | Franklin Lakes | 11,084 | 7,905 | 71.3% |
| 79 | Roseland | 6,268 | 4,457 | 71.1% |
| 80 | Rockaway | 6,613 | 4,685 | 70.8% |
| 81 | Springdale | 15,173 | 10,720 | 70.7% |
| 82 | Mercerville | 13,535 | 9,559 | 70.6% |
| 83 | Hammonton | 14,840 | 10,452 | 70.4% |
| 84 | Ventnor City | 9,265 | 6,524 | 70.4% |
| 85 | Boonton | 8,854 | 6,220 | 70.3% |
| 86 | Wallington | 11,889 | 8,351 | 70.2% |
| 87 | Watchung | 6,485 | 4,532 | 69.9% |
| 88 | Emerson | 7,305 | 5,085 | 69.6% |
| 89 | Wanaque | 11,206 | 7,791 | 69.5% |
| 90 | Montvale | 8,901 | 6,178 | 69.4% |
| 91 | Fanwood | 7,799 | 5,410 | 69.4% |
| 92 | Berlin | 7,539 | 5,226 | 69.3% |
| 93 | Washington | 7,334 | 5,079 | 69.3% |
| 94 | Ramsey | 14,805 | 10,250 | 69.2% |
| 95 | Bellmawr | 11,737 | 8,090 | 68.9% |
| 96 | Absecon | 9,170 | 6,302 | 68.7% |
| 97 | Hopatcong | 14,565 | 9,944 | 68.3% |
| 98 | Somers Point | 10,515 | 7,142 | 67.9% |
| 99 | New Providence | 13,727 | 9,319 | 67.9% |
| 100 | Pine Lake Park | 9,795 | 6,637 | 67.8% |
Source: U.S. Census ACS 2020-2024. 251 cities with more than 5,000 residents.
Summary
Summary: White Populations Across New Jersey
We measured the locations with the highest percentage of white people in New Jersey. According to the most recent data, this list provides accurate information on the whitest places in New Jersey.
The most White cities in New Jersey are Little Silver, Fair Haven, Margate City, Crestwood Village, Manasquan, Pitman, Villas, Haddon Heights, Rumson, and Audubon. Not sold on New Jersey? Take the two-minute Find Your Place quiz and see which state actually fits you.


