Newton SnackAbility
Overall SnackAbility
Crime in Newton summary. We use data from the FBI to determine the crime rates in Newton. Key points include:
There were 73 total crimes in Newton in the last reporting year.
The overall crime rate per 100,000 people in Newton is 889.6 / 100k people.
The violent crime rate per 100,000 people in Newton is 146.2 / 100k people.
The property crime rate per 100,000 people in Newton is 743.4 / 100k people.
Overall, crime in Newton is -58.02% below the national average.
Total Crimes
Below National Average
Crime In Newton Comparison Table
| Statistic | Count Raw |
Newton / 100k People |
New Jersey / 100k People |
National / 100k People |
|---|---|---|---|---|
| Total Crimes Per 100K | 73 | 889.6 | 1,645.1 | 2,119.2 |
| Violent Crime | 12 | 146.2 | 217.7 | 359.0 |
| Murder | 0 | 0.0 | 2.3 | 5.0 |
| Robbery | 0 | 0.0 | 49.3 | 61.0 |
| Aggravated Assault | 10 | 121.9 | 148.8 | 256.0 |
| Property Crime | 61 | 743.4 | 1,427.3 | 1,760.0 |
| Burglary | 0 | 0.0 | 145.3 | 229.0 |
| Larceny | 58 | 706.8 | 1,119.4 | 1,272.0 |
| Car Theft | 3 | 36.6 | 162.6 | 259.0 |
Source: FBI Uniform Crime Reporting (2024)
Cost of living in Newton summary. We use data on the cost of living to determine how expensive it is to live in Newton. Real estate prices drive most of the variance in cost of living around New Jersey. Key points include:
The cost of living in Newton is 119 with 100 being average.
The cost of living in Newton is 1.2x higher than the national average.
The median home value in Newton is $437,913.
The median income in Newton is $76,221.
Newton's Overall Cost Of Living
Higher Than The National Average
Cost Of Living In Newton Comparison Table
| Living Expense | Newton | New Jersey | National Average |
|---|---|---|---|
| Overall | 119 | 125 | 100 |
| Services | 108 | 107 | 100 |
| Groceries | 113 | 113 | 100 |
| Health | 123 | 155 | 100 |
| Housing | 121 | 116 | 100 |
| Transportation | 112 | 112 | 100 |
| Utilities | 111 | 113 | 100 |
Source: Cost of living index, normalized to US average = 100
Newton, NJ Weather
The average high in Newton is 59.9° and the average low is 38.9°.
There are 78.2 days of precipitation each year.
Expect an average of 46.2 inches of precipitation each year with 38.8 inches of snow.
| Stat | Newton |
|---|---|
| Average Annual High | 59.9 |
| Average Annual Low | 38.9 |
| Annual Precipitation Days | 78.2 |
| Average Annual Precipitation | 46.2 |
| Average Annual Snowfall | 38.8 |
Average High
Days of Rain
Source: NOAA climate normals (30-year)
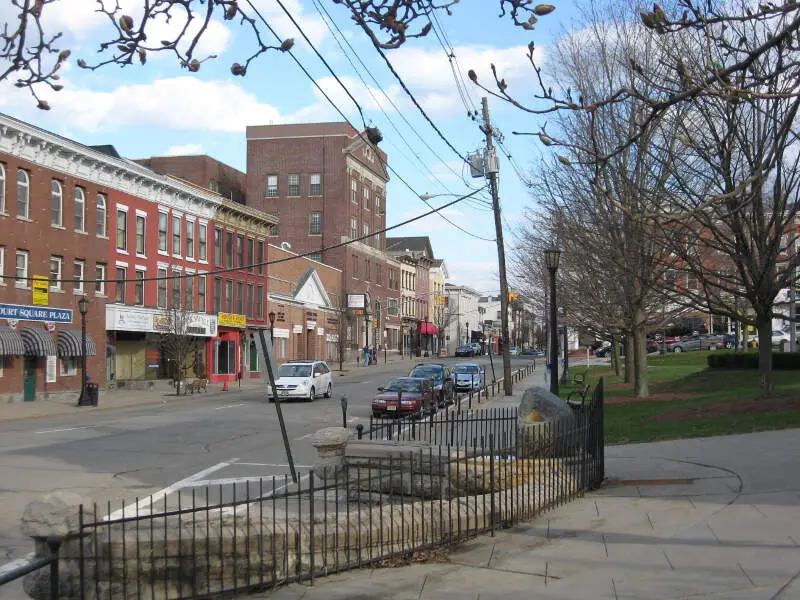
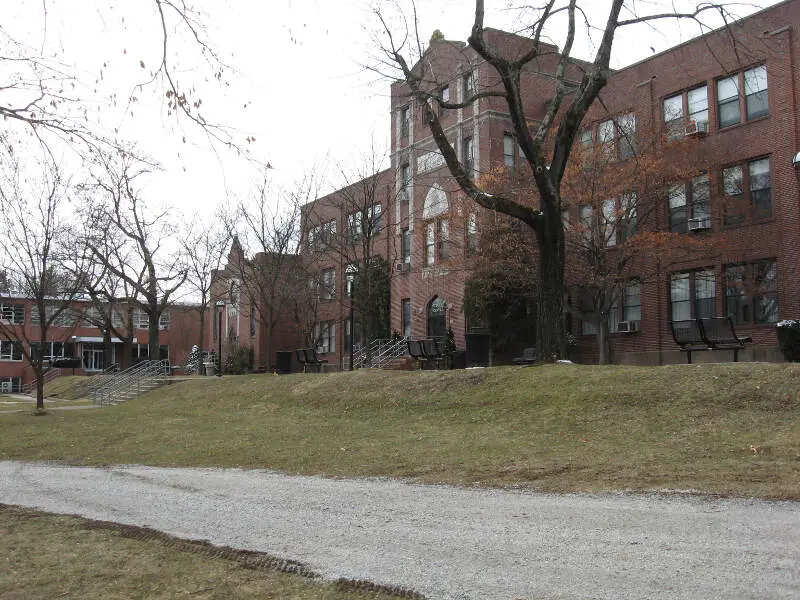
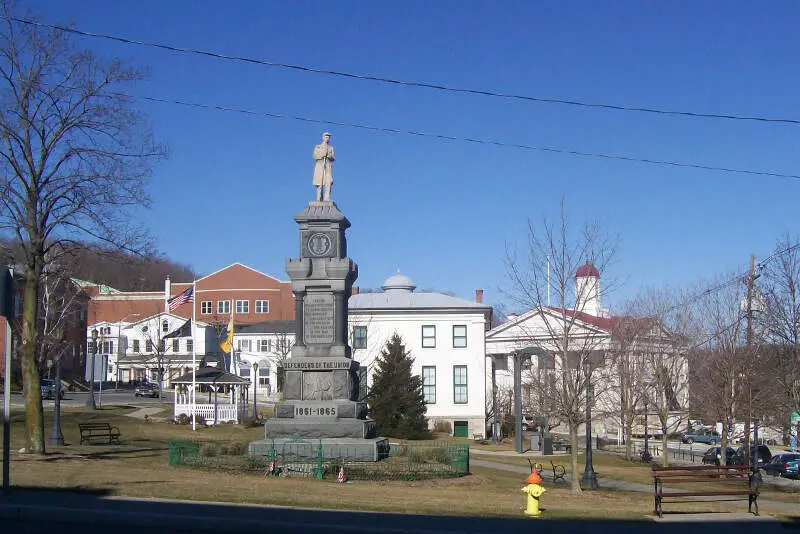
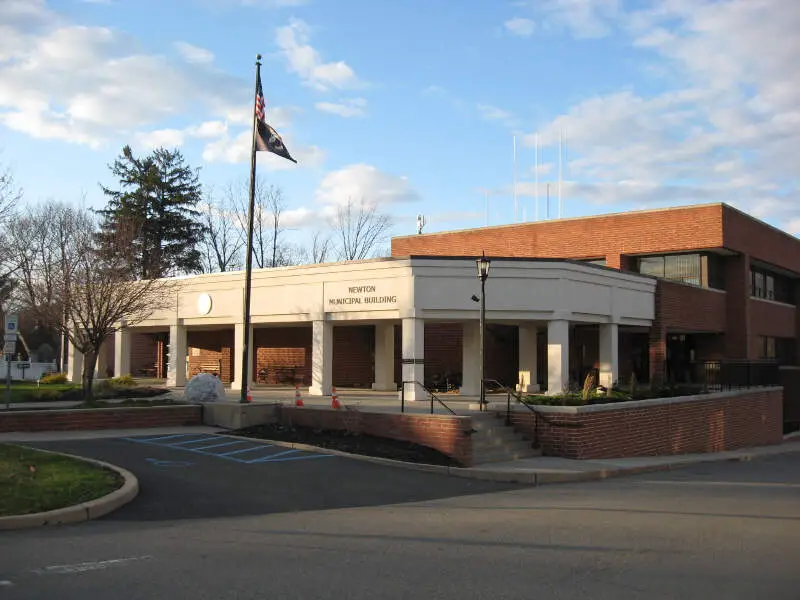
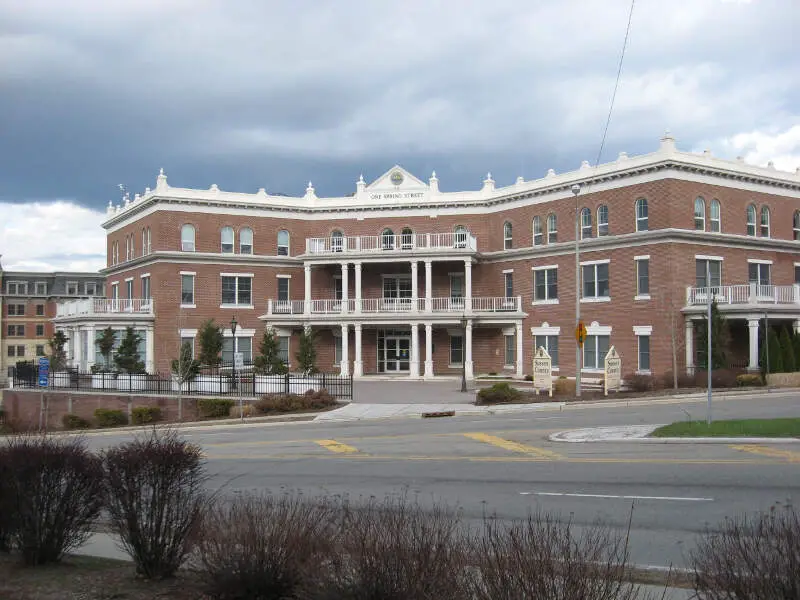
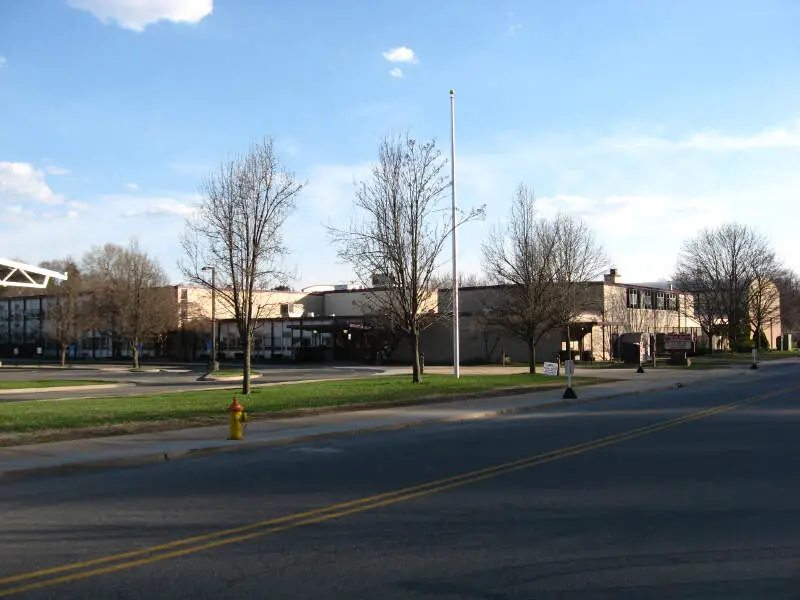
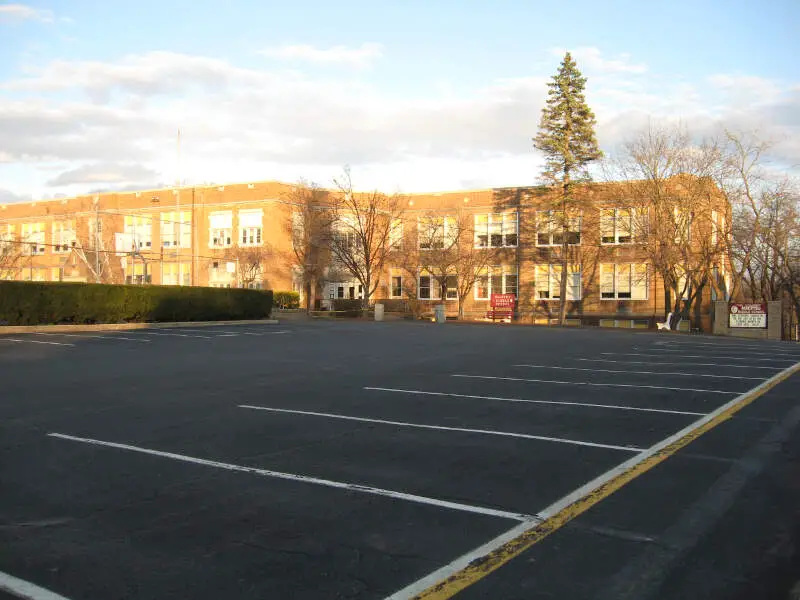
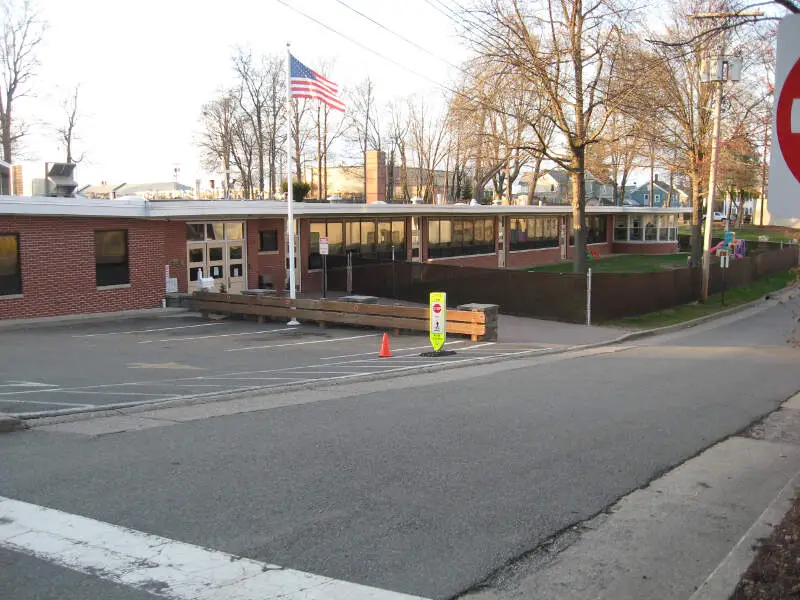
Newton, NJ Photos

Rankings & Articles For Newton


Locations Around Newton
Map Of Newton, NJ
Best Places Around Newton
Succasunna, NJ
Population 9,799
White Meadow Lake, NJ
Population 8,842
Wharton, NJ
Population 7,318
Kinnelon, NJ
Population 10,013
Lake Mohawk, NJ
Population 9,508
Hopatcong, NJ
Population 14,565
Mount Arlington, NJ
Population 5,935
Budd Lake, NJ
Population 10,650
Dover, NJ
Population 18,563
Newton Demographics And Statistics
Population over time in Newton
The current population in Newton is 8,369. The population has increased 3.1% from 2010.
| Year | Population | % Change |
|---|---|---|
| 2024 | 8,369 | 0.4% |
| 2023 | 8,336 | -0.4% |
| 2022 | 8,370 | -0.6% |
| 2021 | 8,423 | 6.1% |
| 2020 | 7,935 | 0.3% |
| 2019 | 7,910 | 0.2% |
| 2018 | 7,895 | -0.5% |
| 2017 | 7,937 | -0.6% |
| 2016 | 7,982 | -0.7% |
| 2015 | 8,036 | 0.5% |
| 2014 | 7,999 | -0.5% |
| 2013 | 8,043 | 0.8% |
| 2012 | 7,983 | -1.0% |
| 2011 | 8,065 | -0.7% |
| 2010 | 8,121 | - |
Race / Ethnicity in Newton
See the full breakdown
Newton is:
72.7% White with 6,085 White residents.
9.3% African American with 775 African American residents.
0.0% American Indian with 0 American Indian residents.
1.4% Asian with 121 Asian residents.
0.0% Hawaiian with 0 Hawaiian residents.
0.3% Other with 21 Other residents.
4.3% Two Or More with 362 Two Or More residents.
12.0% Hispanic with 1,005 Hispanic residents.
| Race | Newton | NJ | USA |
|---|---|---|---|
| White | 72.7% | 50.9% | 57.4% |
| African American | 9.3% | 12.2% | 11.9% |
| American Indian | 0.0% | 0.1% | 0.5% |
| Asian | 1.4% | 10.0% | 5.9% |
| Hawaiian | 0.0% | 0.0% | 0.2% |
| Other | 0.3% | 0.8% | 0.6% |
| Two Or More | 4.3% | 3.5% | 4.3% |
| Hispanic | 12.0% | 22.5% | 19.3% |
Gender in Newton
See the full breakdown
Newton is 52.4% female with 4,385 female residents.
Newton is 47.6% male with 3,984 male residents.
| Gender | Newton | NJ | USA |
|---|---|---|---|
| Female | 52.4% | 50.8% | 50.5% |
| Male | 47.6% | 49.2% | 49.5% |
Highest level of educational attainment in Newton for adults over 25
See the full breakdown
3.0% of adults in Newton completed < 9th grade.
4.0% of adults in Newton completed 9-12th grade.
31.0% of adults in Newton completed high school / ged.
19.0% of adults in Newton completed some college.
12.0% of adults in Newton completed associate's degree.
23.0% of adults in Newton completed bachelor's degree.
7.0% of adults in Newton completed master's degree.
0.0% of adults in Newton completed professional degree.
1.0% of adults in Newton completed doctorate degree.
| Education | Newton | NJ | USA |
|---|---|---|---|
| < 9th Grade | 3.0% | 4.0% | 4.0% |
| 9-12th Grade | 4.0% | 5.0% | 6.0% |
| High School / GED | 31.0% | 25.0% | 26.0% |
| Some College | 19.0% | 15.0% | 19.0% |
| Associate's Degree | 12.0% | 7.0% | 9.0% |
| Bachelor's Degree | 23.0% | 26.0% | 22.0% |
| Master's Degree | 7.0% | 13.0% | 10.0% |
| Professional Degree | 0.0% | 3.0% | 2.0% |
| Doctorate Degree | 1.0% | 2.0% | 2.0% |
Household Income For Newton, New Jersey
See the full breakdown
6.8% of households in Newton earn Less than $10,000.
3.2% of households in Newton earn $10,000 to $14,999.
6.7% of households in Newton earn $15,000 to $24,999.
7.9% of households in Newton earn $25,000 to $34,999.
7.7% of households in Newton earn $35,000 to $49,999.
16.4% of households in Newton earn $50,000 to $74,999.
8.4% of households in Newton earn $75,000 to $99,999.
19.6% of households in Newton earn $100,000 to $149,999.
11.3% of households in Newton earn $150,000 to $199,999.
11.9% of households in Newton earn $200,000 or more.
| Income | Newton | NJ | USA |
|---|---|---|---|
| Less than $10,000 | 6.8% | 4.1% | 5.0% |
| $10,000 to $14,999 | 3.2% | 2.7% | 3.4% |
| $15,000 to $24,999 | 6.7% | 4.8% | 6.3% |
| $25,000 to $34,999 | 7.9% | 5.1% | 6.6% |
| $35,000 to $49,999 | 7.7% | 7.6% | 10.1% |
| $50,000 to $74,999 | 16.4% | 12.8% | 15.5% |
| $75,000 to $99,999 | 8.4% | 11.3% | 12.6% |
| $100,000 to $149,999 | 19.6% | 18.1% | 17.5% |
| $150,000 to $199,999 | 11.3% | 11.8% | 9.6% |
| $200,000 or more | 11.9% | 21.6% | 13.4% |
Source: U.S. Census ACS 5-year estimates (2024)


