New Providence SnackAbility
Overall SnackAbility
Crime in New Providence summary. We use data from the FBI to determine the crime rates in New Providence. Key points include:
There were 41 total crimes in New Providence in the last reporting year.
The overall crime rate per 100,000 people in New Providence is 298.9 / 100k people.
The violent crime rate per 100,000 people in New Providence is 43.7 / 100k people.
The property crime rate per 100,000 people in New Providence is 255.2 / 100k people.
Overall, crime in New Providence is -85.90% below the national average.
Total Crimes
Below National Average
Crime In New Providence Comparison Table
| Statistic | Count Raw |
New Providence / 100k People |
New Jersey / 100k People |
National / 100k People |
|---|---|---|---|---|
| Total Crimes Per 100K | 41 | 298.9 | 1,645.1 | 2,119.2 |
| Violent Crime | 6 | 43.7 | 217.7 | 359.0 |
| Murder | 0 | 0.0 | 2.3 | 5.0 |
| Robbery | 2 | 14.6 | 49.3 | 61.0 |
| Aggravated Assault | 3 | 21.9 | 148.8 | 256.0 |
| Property Crime | 35 | 255.2 | 1,427.3 | 1,760.0 |
| Burglary | 1 | 7.3 | 145.3 | 229.0 |
| Larceny | 32 | 233.3 | 1,119.4 | 1,272.0 |
| Car Theft | 2 | 14.6 | 162.6 | 259.0 |
Source: FBI Uniform Crime Reporting (2024)
Cost of living in New Providence summary. We use data on the cost of living to determine how expensive it is to live in New Providence. Real estate prices drive most of the variance in cost of living around New Jersey. Key points include:
The cost of living in New Providence is 167 with 100 being average.
The cost of living in New Providence is 1.7x higher than the national average.
The median home value in New Providence is $990,084.
The median income in New Providence is $161,599.
New Providence's Overall Cost Of Living
Higher Than The National Average
Cost Of Living In New Providence Comparison Table
| Living Expense | New Providence | New Jersey | National Average |
|---|---|---|---|
| Overall | 167 | 125 | 100 |
| Services | 109 | 107 | 100 |
| Groceries | 110 | 113 | 100 |
| Health | 297 | 155 | 100 |
| Housing | 109 | 116 | 100 |
| Transportation | 107 | 112 | 100 |
| Utilities | 108 | 113 | 100 |
Source: Cost of living index, normalized to US average = 100
New Providence, NJ Weather
The average high in New Providence is 62.8° and the average low is 42.0°.
There are 79.8 days of precipitation each year.
Expect an average of 49.5 inches of precipitation each year with 24.1 inches of snow.
| Stat | New Providence |
|---|---|
| Average Annual High | 62.8 |
| Average Annual Low | 42.0 |
| Annual Precipitation Days | 79.8 |
| Average Annual Precipitation | 49.5 |
| Average Annual Snowfall | 24.1 |
Average High
Days of Rain
Source: NOAA climate normals (30-year)
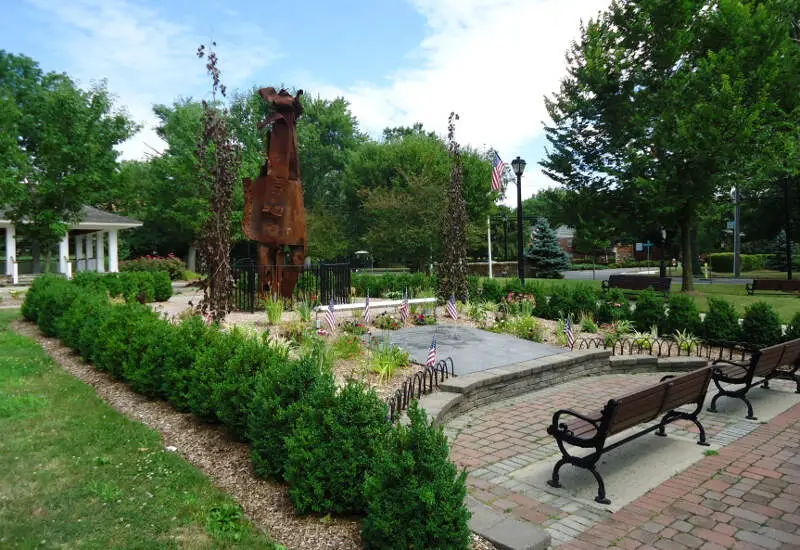
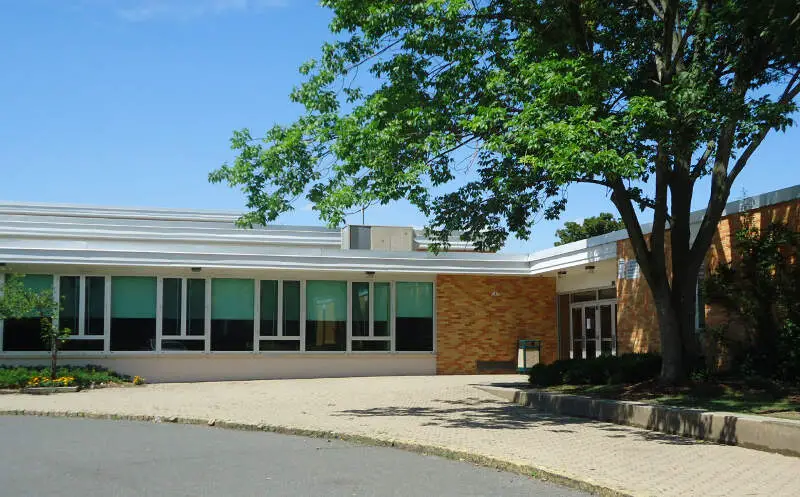
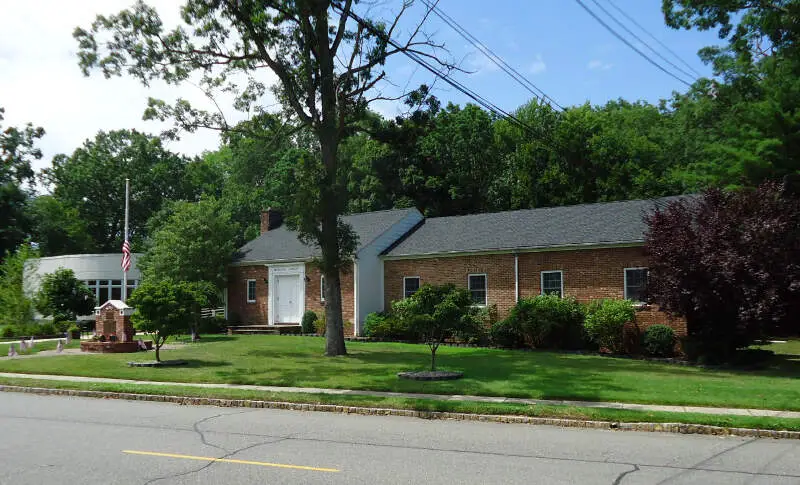
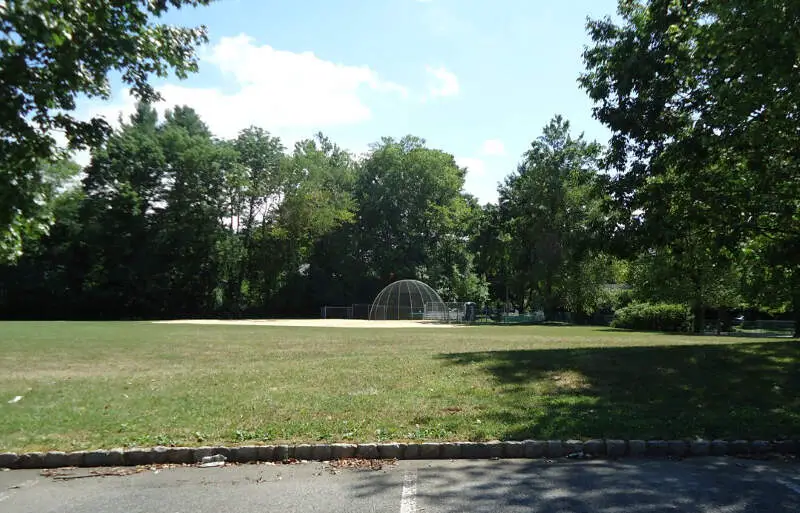
New Providence, NJ Photos


Rankings & Articles For New Providence


Locations Around New Providence
Map Of New Providence, NJ
Best Places Around New Providence
Lincoln Park, NJ
Population 10,957
Martinsville, NJ
Population 11,559
Succasunna, NJ
Population 9,799
Florham Park, NJ
Population 13,564
White Meadow Lake, NJ
Population 8,842
Bradley Gardens, NJ
Population 14,165
Westfield, NJ
Population 31,111
Boonton, NJ
Population 8,854
Green Knoll, NJ
Population 6,789
Wharton, NJ
Population 7,318
New Providence Demographics And Statistics
Population over time in New Providence
The current population in New Providence is 13,727. The population has increased 14.2% from 2010.
| Year | Population | % Change |
|---|---|---|
| 2024 | 13,727 | 1.1% |
| 2023 | 13,577 | -0.1% |
| 2022 | 13,595 | 0.2% |
| 2021 | 13,570 | 1.4% |
| 2020 | 13,382 | 2.6% |
| 2019 | 13,049 | 1.9% |
| 2018 | 12,808 | 0.7% |
| 2017 | 12,716 | 2.3% |
| 2016 | 12,434 | 0.6% |
| 2015 | 12,355 | 0.3% |
| 2014 | 12,314 | 0.7% |
| 2013 | 12,225 | 0.3% |
| 2012 | 12,191 | 1.0% |
| 2011 | 12,076 | 0.5% |
| 2010 | 12,018 | - |
Race / Ethnicity in New Providence
See the full breakdown
New Providence is:
67.9% White with 9,319 White residents.
1.8% African American with 243 African American residents.
0.0% American Indian with 0 American Indian residents.
14.8% Asian with 2,033 Asian residents.
0.1% Hawaiian with 7 Hawaiian residents.
0.2% Other with 33 Other residents.
6.4% Two Or More with 881 Two Or More residents.
8.8% Hispanic with 1,211 Hispanic residents.
| Race | New Providence | NJ | USA |
|---|---|---|---|
| White | 67.9% | 50.9% | 57.4% |
| African American | 1.8% | 12.2% | 11.9% |
| American Indian | 0.0% | 0.1% | 0.5% |
| Asian | 14.8% | 10.0% | 5.9% |
| Hawaiian | 0.1% | 0.0% | 0.2% |
| Other | 0.2% | 0.8% | 0.6% |
| Two Or More | 6.4% | 3.5% | 4.3% |
| Hispanic | 8.8% | 22.5% | 19.3% |
Gender in New Providence
See the full breakdown
New Providence is 48.3% female with 6,632 female residents.
New Providence is 51.7% male with 7,095 male residents.
| Gender | New Providence | NJ | USA |
|---|---|---|---|
| Female | 48.3% | 50.8% | 50.5% |
| Male | 51.7% | 49.2% | 49.5% |
Highest level of educational attainment in New Providence for adults over 25
See the full breakdown
2.0% of adults in New Providence completed < 9th grade.
1.0% of adults in New Providence completed 9-12th grade.
14.0% of adults in New Providence completed high school / ged.
10.0% of adults in New Providence completed some college.
5.0% of adults in New Providence completed associate's degree.
36.0% of adults in New Providence completed bachelor's degree.
23.0% of adults in New Providence completed master's degree.
6.0% of adults in New Providence completed professional degree.
3.0% of adults in New Providence completed doctorate degree.
| Education | New Providence | NJ | USA |
|---|---|---|---|
| < 9th Grade | 2.0% | 4.0% | 4.0% |
| 9-12th Grade | 1.0% | 5.0% | 6.0% |
| High School / GED | 14.0% | 25.0% | 26.0% |
| Some College | 10.0% | 15.0% | 19.0% |
| Associate's Degree | 5.0% | 7.0% | 9.0% |
| Bachelor's Degree | 36.0% | 26.0% | 22.0% |
| Master's Degree | 23.0% | 13.0% | 10.0% |
| Professional Degree | 6.0% | 3.0% | 2.0% |
| Doctorate Degree | 3.0% | 2.0% | 2.0% |
Household Income For New Providence, New Jersey
See the full breakdown
0.7% of households in New Providence earn Less than $10,000.
1.6% of households in New Providence earn $10,000 to $14,999.
2.9% of households in New Providence earn $15,000 to $24,999.
2.8% of households in New Providence earn $25,000 to $34,999.
4.1% of households in New Providence earn $35,000 to $49,999.
8.9% of households in New Providence earn $50,000 to $74,999.
11.6% of households in New Providence earn $75,000 to $99,999.
14.0% of households in New Providence earn $100,000 to $149,999.
15.6% of households in New Providence earn $150,000 to $199,999.
37.7% of households in New Providence earn $200,000 or more.
| Income | New Providence | NJ | USA |
|---|---|---|---|
| Less than $10,000 | 0.7% | 4.1% | 5.0% |
| $10,000 to $14,999 | 1.6% | 2.7% | 3.4% |
| $15,000 to $24,999 | 2.9% | 4.8% | 6.3% |
| $25,000 to $34,999 | 2.8% | 5.1% | 6.6% |
| $35,000 to $49,999 | 4.1% | 7.6% | 10.1% |
| $50,000 to $74,999 | 8.9% | 12.8% | 15.5% |
| $75,000 to $99,999 | 11.6% | 11.3% | 12.6% |
| $100,000 to $149,999 | 14.0% | 18.1% | 17.5% |
| $150,000 to $199,999 | 15.6% | 11.8% | 9.6% |
| $200,000 or more | 37.7% | 21.6% | 13.4% |
Source: U.S. Census ACS 5-year estimates (2024)


