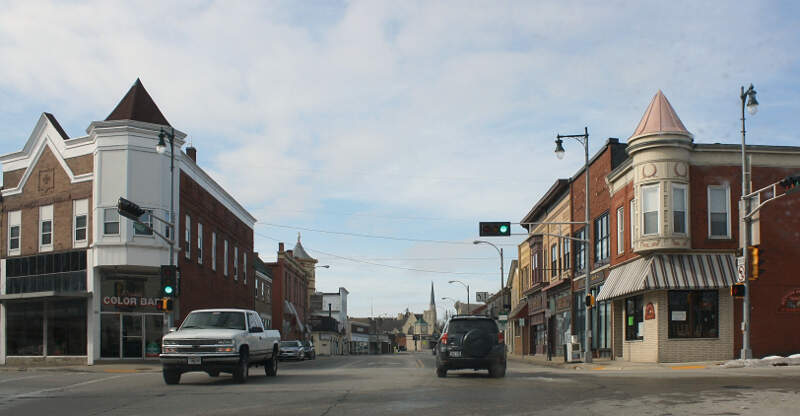
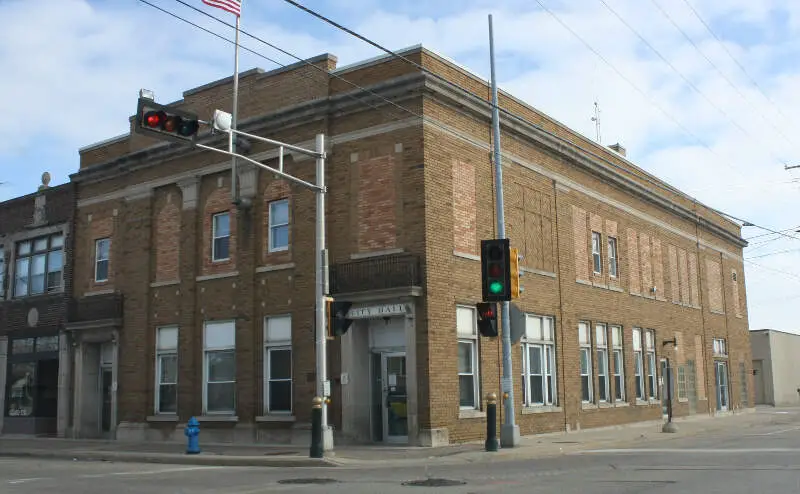
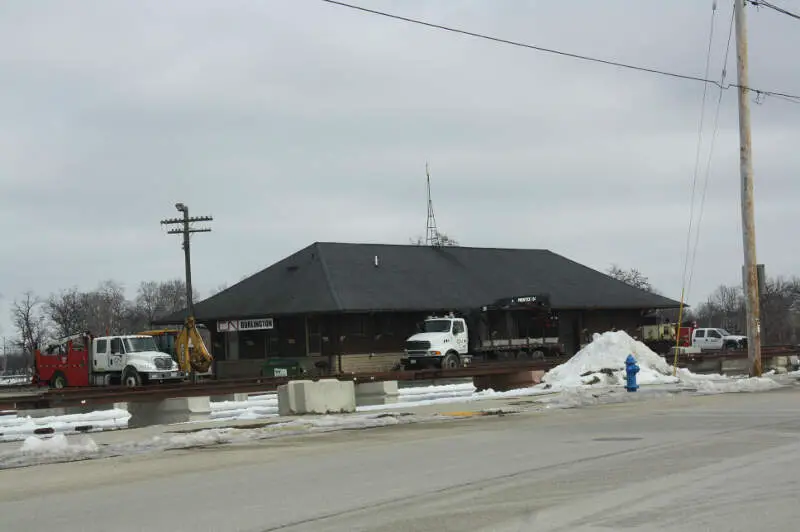
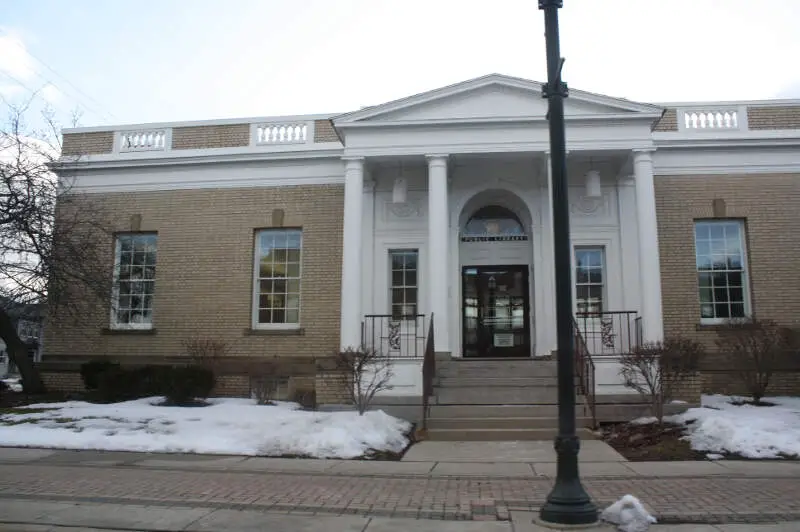
Burlington, WI
Demographics And Statistics
Living In Burlington, Wisconsin Summary
Life in Burlington research summary. HomeSnacks has been using Saturday Night Science to research the quality of life in Burlington over the past nine years using Census, FBI, Zillow, and other primary data sources. Based on the most recently available data, we found the following about life in Burlington:
The population in Burlington is 11,021.
The median home value in Burlington is $346,614.
The median income in Burlington is $81,658.
The cost of living in Burlington is 101 which is 1.0x higher than the national average.
The median rent in Burlington is $967.
The unemployment rate in Burlington is 2.5%.
The poverty rate in Burlington is 11.7%.
The average high in Burlington is 57.1° and the average low is 37.5°.
Burlington SnackAbility
Overall SnackAbility
Burlington, WI Crime Report
Crime in Burlington summary. We use data from the FBI to determine the crime rates in Burlington. Key points include:
There were 117 total crimes in Burlington in the last reporting year.
The overall crime rate per 100,000 people in Burlington is 1,059.6 / 100k people.
The violent crime rate per 100,000 people in Burlington is 99.6 / 100k people.
The property crime rate per 100,000 people in Burlington is 960.0 / 100k people.
Overall, crime in Burlington is -50.00% below the national average.
Total Crimes
Below National Average
Crime In Burlington Comparison Table
| Statistic | Count Raw |
Burlington / 100k People |
Wisconsin / 100k People |
National / 100k People |
|---|---|---|---|---|
| Total Crimes Per 100K | 117 | 1,059.6 | 1,432.6 | 2,119.2 |
| Violent Crime | 11 | 99.6 | 278.5 | 359.0 |
| Murder | 0 | 0.0 | 4.2 | 5.0 |
| Robbery | 0 | 0.0 | 39.4 | 61.0 |
| Aggravated Assault | 8 | 72.5 | 200.1 | 256.0 |
| Property Crime | 106 | 960.0 | 1,154.1 | 1,760.0 |
| Burglary | 0 | 0.0 | 117.2 | 229.0 |
| Larceny | 102 | 923.7 | 875.6 | 1,272.0 |
| Car Theft | 4 | 36.2 | 161.3 | 259.0 |
Burlington, WI Cost Of Living
Cost of living in Burlington summary. We use data on the cost of living to determine how expensive it is to live in Burlington. Real estate prices drive most of the variance in cost of living around Wisconsin. Key points include:
The cost of living in Burlington is 101 with 100 being average.
The cost of living in Burlington is 1.0x higher than the national average.
The median home value in Burlington is $346,614.
The median income in Burlington is $81,658.
Burlington's Overall Cost Of Living
Higher Than The National Average
Cost Of Living In Burlington Comparison Table
| Living Expense | Burlington | Wisconsin | National Average | |
|---|---|---|---|---|
| Overall | 101 | 95 | 100 | |
| Services | 99 | 98 | 100 | |
| Groceries | 105 | 100 | 100 | |
| Health | 110 | 111 | 100 | |
| Housing | 105 | 88 | 100 | |
| Transportation | 98 | 100 | 100 | |
| Utilities | 105 | 102 | 100 | |
Burlington, WI Weather
The average high in Burlington is 57.1° and the average low is 37.5°.
There are 68.2 days of precipitation each year.
Expect an average of 34.2 inches of precipitation each year with 36.8 inches of snow.
| Stat | Burlington |
|---|---|
| Average Annual High | 57.1 |
| Average Annual Low | 37.5 |
| Annual Precipitation Days | 68.2 |
| Average Annual Precipitation | 34.2 |
| Average Annual Snowfall | 36.8 |
Average High
Days of Rain
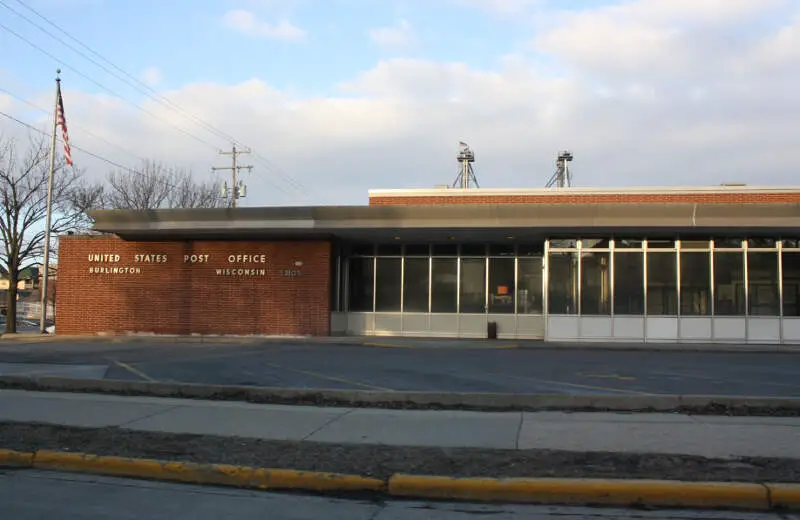
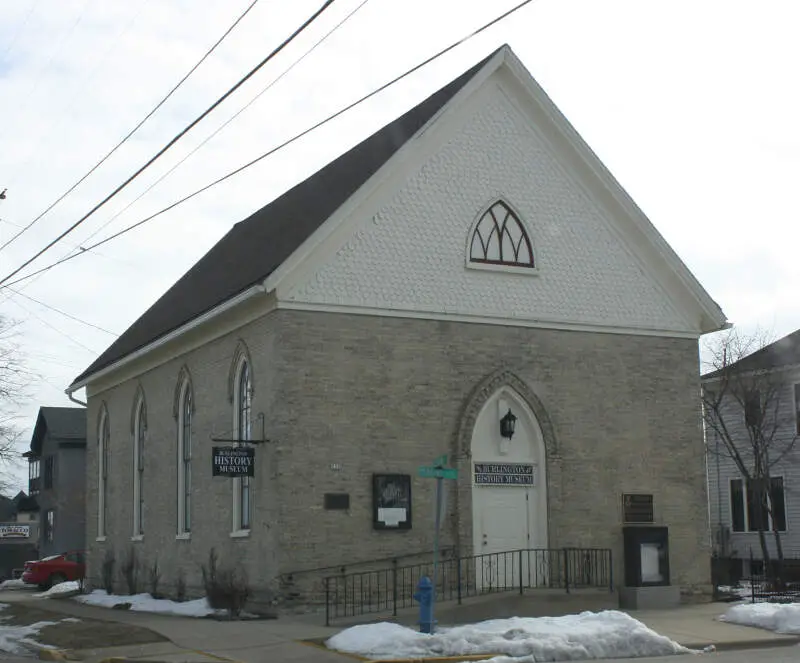
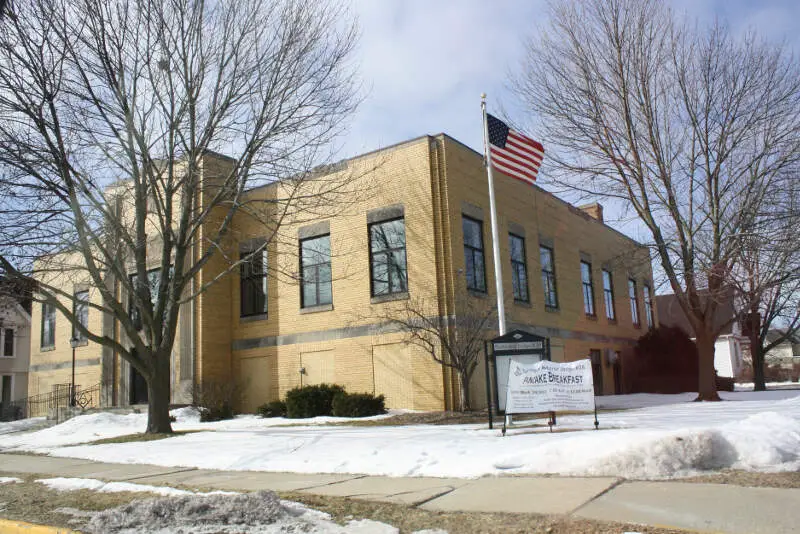
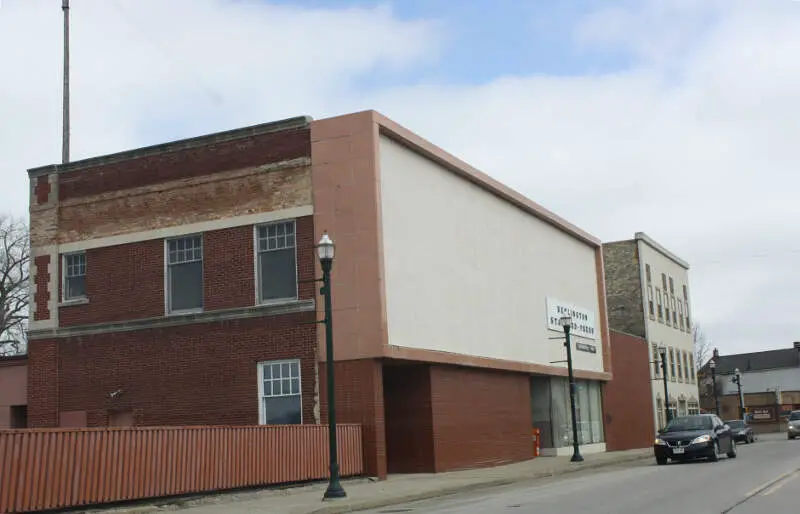
Burlington, WI Photos
Rankings for Burlington in Wisconsin


Locations Around Burlington
Map Of Burlington, WI
Best Places Around Burlington
Antioch, IL
Population 14,751
Spring Grove, IL
Population 5,866
Fox Lake, IL
Population 10,872
Muskego, WI
Population 25,156
Franklin, WI
Population 35,751
Mukwonago, WI
Population 8,411
Wind Lake, WI
Population 5,028
Tichigan, WI
Population 5,173
Waterford, WI
Population 5,627
Sturtevant, WI
Population 6,787
Burlington Demographics And Statistics
Population over time in Burlington
The current population in Burlington is 11,021. The population has increased 6.0% from 2010.
| Year | Population | % Change |
|---|---|---|
| 2023 | 11,021 | 0.2% |
| 2022 | 11,000 | 0.3% |
| 2021 | 10,971 | 0.5% |
| 2020 | 10,911 | 0.6% |
| 2019 | 10,847 | 0.8% |
| 2018 | 10,758 | 1.0% |
| 2017 | 10,652 | 0.8% |
| 2016 | 10,571 | 0.2% |
| 2015 | 10,548 | 0.2% |
| 2014 | 10,528 | 0.3% |
| 2013 | 10,498 | 0.1% |
| 2012 | 10,492 | 0.6% |
| 2011 | 10,434 | 0.3% |
| 2010 | 10,398 | - |
Race / Ethnicity in Burlington
Burlington is:
83.7% White with 9,229 White residents.
1.8% African American with 193 African American residents.
0.0% American Indian with 2 American Indian residents.
1.6% Asian with 179 Asian residents.
0.1% Hawaiian with 10 Hawaiian residents.
0.0% Other with 0 Other residents.
3.5% Two Or More with 388 Two Or More residents.
9.3% Hispanic with 1,020 Hispanic residents.
| Race | Burlington | WI | USA |
|---|---|---|---|
| White | 83.7% | 79.2% | 58.2% |
| African American | 1.8% | 6.0% | 12.0% |
| American Indian | 0.0% | 0.6% | 0.5% |
| Asian | 1.6% | 2.9% | 5.7% |
| Hawaiian | 0.1% | 0.0% | 0.2% |
| Other | 0.0% | 0.3% | 0.5% |
| Two Or More | 3.5% | 3.3% | 3.9% |
| Hispanic | 9.3% | 7.8% | 19.0% |
Gender in Burlington
Burlington is 51.5% female with 5,676 female residents.
Burlington is 48.5% male with 5,345 male residents.
| Gender | Burlington | WI | USA |
|---|---|---|---|
| Female | 51.5% | 49.9% | 50.5% |
| Male | 48.5% | 50.1% | 49.5% |
Highest level of educational attainment in Burlington for adults over 25
1.0% of adults in Burlington completed < 9th grade.
3.0% of adults in Burlington completed 9-12th grade.
36.0% of adults in Burlington completed high school / ged.
22.0% of adults in Burlington completed some college.
10.0% of adults in Burlington completed associate's degree.
16.0% of adults in Burlington completed bachelor's degree.
10.0% of adults in Burlington completed master's degree.
2.0% of adults in Burlington completed professional degree.
0.0% of adults in Burlington completed doctorate degree.
| Education | Burlington | WI | USA |
|---|---|---|---|
| < 9th Grade | 1.0% | 2.0% | 5.0% |
| 9-12th Grade | 3.0% | 4.0% | 6.0% |
| High School / GED | 36.0% | 30.0% | 26.0% |
| Some College | 22.0% | 20.0% | 19.0% |
| Associate's Degree | 10.0% | 11.0% | 9.0% |
| Bachelor's Degree | 16.0% | 22.0% | 21.0% |
| Master's Degree | 10.0% | 8.0% | 10.0% |
| Professional Degree | 2.0% | 2.0% | 2.0% |
| Doctorate Degree | 0.0% | 1.0% | 2.0% |
Household Income For Burlington, Wisconsin
5.6% of households in Burlington earn Less than $10,000.
4.2% of households in Burlington earn $10,000 to $14,999.
5.3% of households in Burlington earn $15,000 to $24,999.
11.1% of households in Burlington earn $25,000 to $34,999.
7.4% of households in Burlington earn $35,000 to $49,999.
10.2% of households in Burlington earn $50,000 to $74,999.
17.0% of households in Burlington earn $75,000 to $99,999.
22.5% of households in Burlington earn $100,000 to $149,999.
10.1% of households in Burlington earn $150,000 to $199,999.
6.8% of households in Burlington earn $200,000 or more.
| Income | Burlington | WI | USA |
|---|---|---|---|
| Less than $10,000 | 5.6% | 4.0% | 4.9% |
| $10,000 to $14,999 | 4.2% | 3.2% | 3.6% |
| $15,000 to $24,999 | 5.3% | 6.2% | 6.6% |
| $25,000 to $34,999 | 11.1% | 7.4% | 6.8% |
| $35,000 to $49,999 | 7.4% | 10.9% | 10.4% |
| $50,000 to $74,999 | 10.2% | 17.8% | 15.7% |
| $75,000 to $99,999 | 17.0% | 14.0% | 12.7% |
| $100,000 to $149,999 | 22.5% | 18.9% | 17.4% |
| $150,000 to $199,999 | 10.1% | 8.9% | 9.3% |
| $200,000 or more | 6.8% | 8.6% | 12.6% |


