Eau Claire SnackAbility
Overall SnackAbility
Crime in Eau Claire summary. We use data from the FBI to determine the crime rates in Eau Claire. Key points include:
There were 1,466 total crimes in Eau Claire in the last reporting year.
The overall crime rate per 100,000 people in Eau Claire is 2,068.0 / 100k people.
The violent crime rate per 100,000 people in Eau Claire is 162.2 / 100k people.
The property crime rate per 100,000 people in Eau Claire is 1,905.7 / 100k people.
Overall, crime in Eau Claire is -2.42% below the national average.
Total Crimes
Below National Average
Crime In Eau Claire Comparison Table
| Statistic | Count Raw |
Eau Claire / 100k People |
Wisconsin / 100k People |
National / 100k People |
|---|---|---|---|---|
| Total Crimes Per 100K | 1,466 | 2,068.0 | 1,432.6 | 2,119.2 |
| Violent Crime | 115 | 162.2 | 278.5 | 359.0 |
| Murder | 2 | 2.8 | 4.2 | 5.0 |
| Robbery | 7 | 9.9 | 39.4 | 61.0 |
| Aggravated Assault | 66 | 93.1 | 200.1 | 256.0 |
| Property Crime | 1,351 | 1,905.7 | 1,154.1 | 1,760.0 |
| Burglary | 179 | 252.5 | 117.2 | 229.0 |
| Larceny | 1,101 | 1,553.1 | 875.6 | 1,272.0 |
| Car Theft | 71 | 100.2 | 161.3 | 259.0 |
Source: FBI Uniform Crime Reporting (2024)
Cost of living in Eau Claire summary. We use data on the cost of living to determine how expensive it is to live in Eau Claire. Real estate prices drive most of the variance in cost of living around Wisconsin. Key points include:
The cost of living in Eau Claire is 95 with 100 being average.
The cost of living in Eau Claire is 0.9x lower than the national average.
The median home value in Eau Claire is $311,026.
The median income in Eau Claire is $67,395.
Eau Claire's Overall Cost Of Living
Lower Than The National Average
Cost Of Living In Eau Claire Comparison Table
| Living Expense | Eau Claire | Wisconsin | National Average |
|---|---|---|---|
| Overall | 95 | 98 | 100 |
| Services | 100 | 98 | 100 |
| Groceries | 97 | 100 | 100 |
| Health | 87 | 91 | 100 |
| Housing | 102 | 99 | 100 |
| Transportation | 101 | 102 | 100 |
| Utilities | 98 | 100 | 100 |
Source: Cost of living index, normalized to US average = 100
Eau Claire, WI Weather
The average high in Eau Claire is 55.2° and the average low is 34.5°.
There are 64.1 days of precipitation each year.
Expect an average of 32.2 inches of precipitation each year with 46.8 inches of snow.
| Stat | Eau Claire |
|---|---|
| Average Annual High | 55.2 |
| Average Annual Low | 34.5 |
| Annual Precipitation Days | 64.1 |
| Average Annual Precipitation | 32.2 |
| Average Annual Snowfall | 46.8 |
Average High
Days of Rain
Source: NOAA climate normals (30-year)
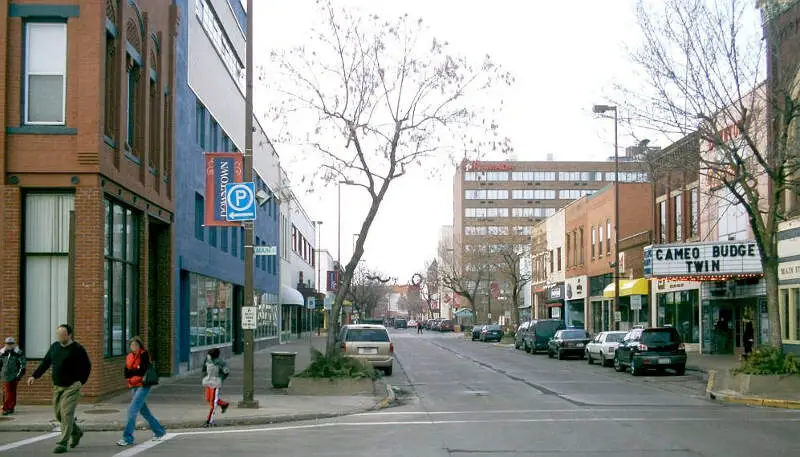
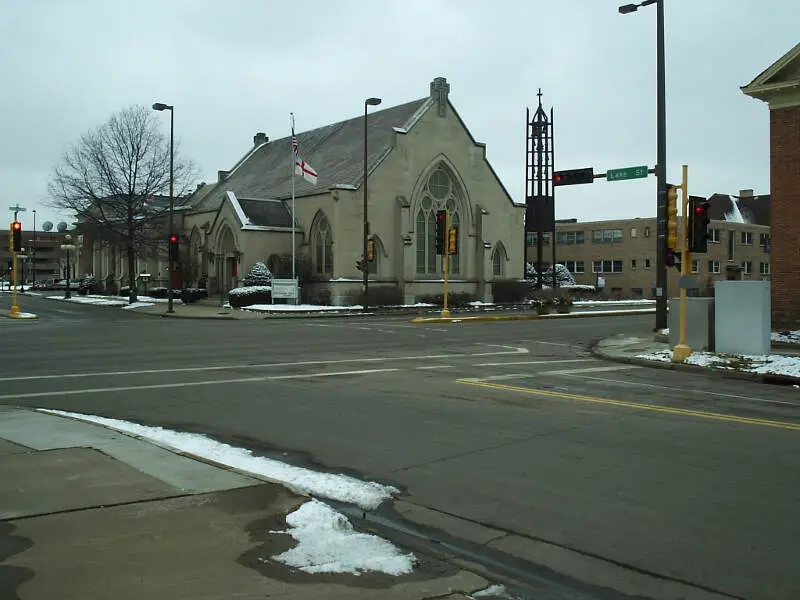
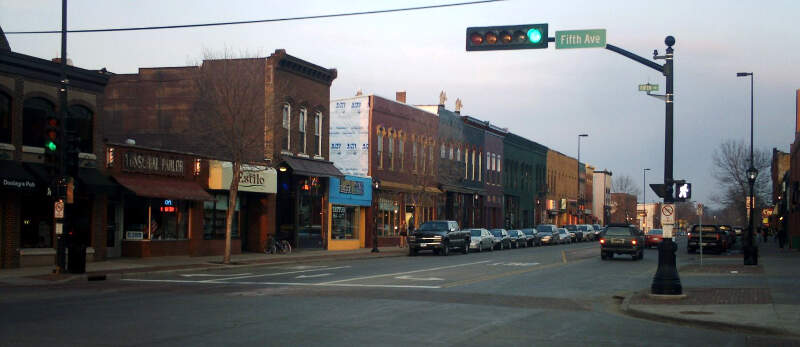
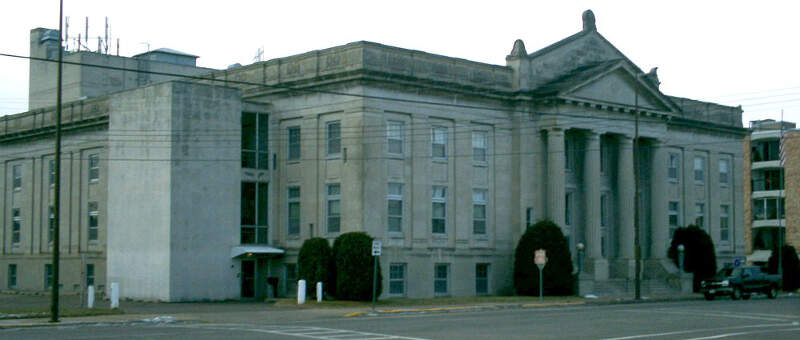
Eau Claire, WI Photos


Rankings & Articles For Eau Claire


Locations Around Eau Claire
Map Of Eau Claire, WI
Best Places Around Eau Claire
Menomonie, WI
Population 16,539
Lake Hallie, WI
Population 7,285
Altoona, WI
Population 8,878
Chippewa Falls, WI
Population 14,782
Rice Lake, WI
Population 9,030
Eau Claire Demographics And Statistics
Population over time in Eau Claire
The current population in Eau Claire is 70,322. The population has increased 8.0% from 2010.
| Year | Population | % Change |
|---|---|---|
| 2024 | 70,322 | 1.5% |
| 2023 | 69,274 | 0.3% |
| 2022 | 69,098 | 0.1% |
| 2021 | 69,030 | 0.5% |
| 2020 | 68,720 | 0.8% |
| 2019 | 68,187 | 0.1% |
| 2018 | 68,086 | 0.2% |
| 2017 | 67,945 | 0.4% |
| 2016 | 67,654 | 0.4% |
| 2015 | 67,385 | 0.5% |
| 2014 | 67,036 | 0.7% |
| 2013 | 66,551 | 1.0% |
| 2012 | 65,860 | 0.6% |
| 2011 | 65,436 | 0.5% |
| 2010 | 65,133 | - |
Race / Ethnicity in Eau Claire
See the full breakdown
Eau Claire is:
85.5% White with 60,122 White residents.
1.6% African American with 1,156 African American residents.
0.2% American Indian with 171 American Indian residents.
5.4% Asian with 3,780 Asian residents.
0.2% Hawaiian with 138 Hawaiian residents.
0.3% Other with 181 Other residents.
3.9% Two Or More with 2,737 Two Or More residents.
2.9% Hispanic with 2,037 Hispanic residents.
| Race | Eau Claire | WI | USA |
|---|---|---|---|
| White | 85.5% | 78.6% | 57.4% |
| African American | 1.6% | 5.9% | 11.9% |
| American Indian | 0.2% | 0.5% | 0.5% |
| Asian | 5.4% | 2.9% | 5.9% |
| Hawaiian | 0.2% | 0.0% | 0.2% |
| Other | 0.3% | 0.3% | 0.6% |
| Two Or More | 3.9% | 3.7% | 4.3% |
| Hispanic | 2.9% | 8.0% | 19.3% |
Gender in Eau Claire
See the full breakdown
Eau Claire is 51.8% female with 36,452 female residents.
Eau Claire is 48.2% male with 33,870 male residents.
| Gender | Eau Claire | WI | USA |
|---|---|---|---|
| Female | 51.8% | 49.9% | 50.5% |
| Male | 48.2% | 50.1% | 49.5% |
Highest level of educational attainment in Eau Claire for adults over 25
See the full breakdown
1.0% of adults in Eau Claire completed < 9th grade.
2.0% of adults in Eau Claire completed 9-12th grade.
26.0% of adults in Eau Claire completed high school / ged.
19.0% of adults in Eau Claire completed some college.
15.0% of adults in Eau Claire completed associate's degree.
25.0% of adults in Eau Claire completed bachelor's degree.
8.0% of adults in Eau Claire completed master's degree.
2.0% of adults in Eau Claire completed professional degree.
2.0% of adults in Eau Claire completed doctorate degree.
| Education | Eau Claire | WI | USA |
|---|---|---|---|
| < 9th Grade | 1.0% | 4.0% | 4.0% |
| 9-12th Grade | 2.0% | 4.0% | 6.0% |
| High School / GED | 26.0% | 29.0% | 26.0% |
| Some College | 19.0% | 19.0% | 19.0% |
| Associate's Degree | 15.0% | 11.0% | 9.0% |
| Bachelor's Degree | 25.0% | 22.0% | 22.0% |
| Master's Degree | 8.0% | 8.0% | 10.0% |
| Professional Degree | 2.0% | 2.0% | 2.0% |
| Doctorate Degree | 2.0% | 1.0% | 2.0% |
Household Income For Eau Claire, Wisconsin
See the full breakdown
2.7% of households in Eau Claire earn Less than $10,000.
2.8% of households in Eau Claire earn $10,000 to $14,999.
7.5% of households in Eau Claire earn $15,000 to $24,999.
8.5% of households in Eau Claire earn $25,000 to $34,999.
12.0% of households in Eau Claire earn $35,000 to $49,999.
21.7% of households in Eau Claire earn $50,000 to $74,999.
13.4% of households in Eau Claire earn $75,000 to $99,999.
19.1% of households in Eau Claire earn $100,000 to $149,999.
6.4% of households in Eau Claire earn $150,000 to $199,999.
5.9% of households in Eau Claire earn $200,000 or more.
| Income | Eau Claire | WI | USA |
|---|---|---|---|
| Less than $10,000 | 2.7% | 4.1% | 5.0% |
| $10,000 to $14,999 | 2.8% | 3.0% | 3.4% |
| $15,000 to $24,999 | 7.5% | 5.9% | 6.3% |
| $25,000 to $34,999 | 8.5% | 7.2% | 6.6% |
| $35,000 to $49,999 | 12.0% | 10.8% | 10.1% |
| $50,000 to $74,999 | 21.7% | 17.5% | 15.5% |
| $75,000 to $99,999 | 13.4% | 13.8% | 12.6% |
| $100,000 to $149,999 | 19.1% | 19.1% | 17.5% |
| $150,000 to $199,999 | 6.4% | 9.4% | 9.6% |
| $200,000 or more | 5.9% | 9.2% | 13.4% |
Source: U.S. Census ACS 5-year estimates (2024)


