Hobart SnackAbility
Overall SnackAbility
Cost of living in Hobart summary. We use data on the cost of living to determine how expensive it is to live in Hobart. Real estate prices drive most of the variance in cost of living around Wisconsin. Key points include:
The cost of living in Hobart is 109 with 100 being average.
The cost of living in Hobart is 1.1x higher than the national average.
The median home value in Hobart is $481,198.
The median income in Hobart is $103,440.
Hobart's Overall Cost Of Living
Higher Than The National Average
Cost Of Living In Hobart Comparison Table
| Living Expense | Hobart | Wisconsin | National Average |
|---|---|---|---|
| Overall | 109 | 98 | 100 |
| Services | 99 | 98 | 100 |
| Groceries | 95 | 100 | 100 |
| Health | 131 | 91 | 100 |
| Housing | 97 | 99 | 100 |
| Transportation | 101 | 102 | 100 |
| Utilities | 96 | 100 | 100 |
Source: Cost of living index, normalized to US average = 100
Hobart, WI Weather
The average high in Hobart is 54.5° and the average low is 35.3°.
There are 64.7 days of precipitation each year.
Expect an average of 30.2 inches of precipitation each year with 48.9 inches of snow.
| Stat | Hobart |
|---|---|
| Average Annual High | 54.5 |
| Average Annual Low | 35.3 |
| Annual Precipitation Days | 64.7 |
| Average Annual Precipitation | 30.2 |
| Average Annual Snowfall | 48.9 |
Average High
Days of Rain
Source: NOAA climate normals (30-year)
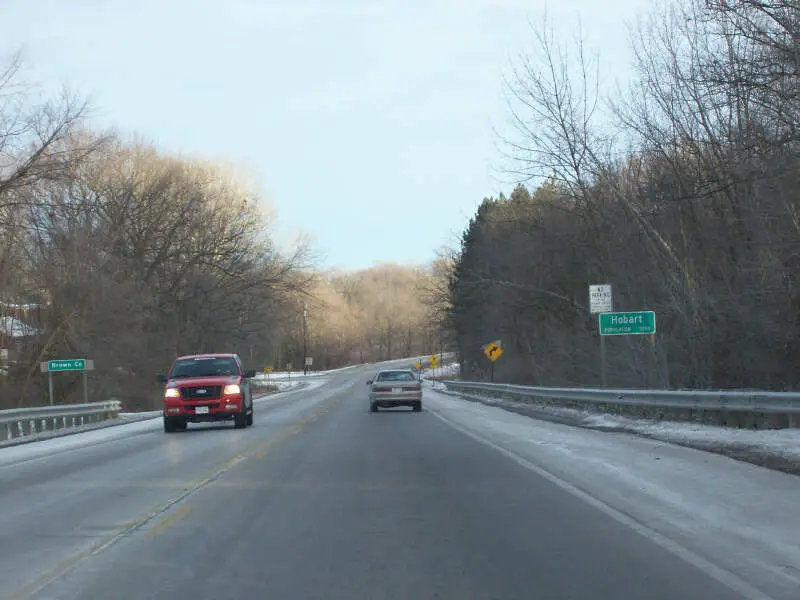
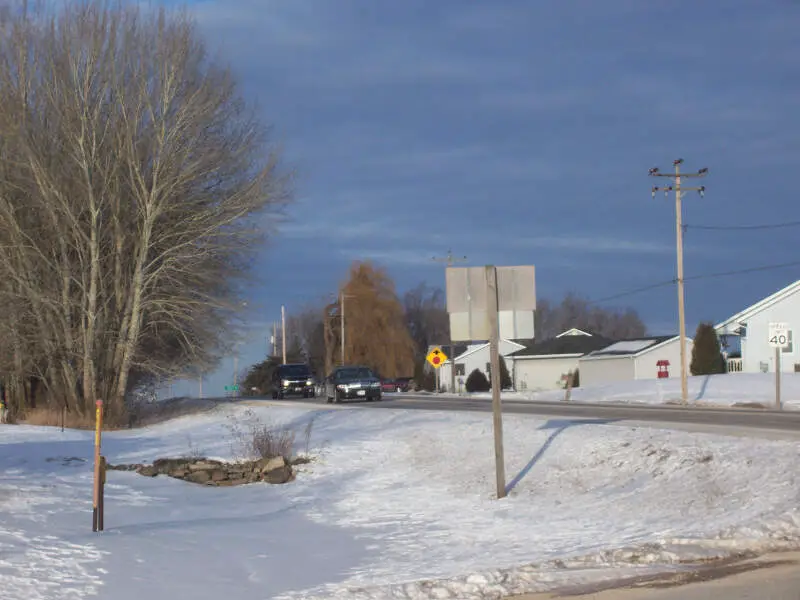
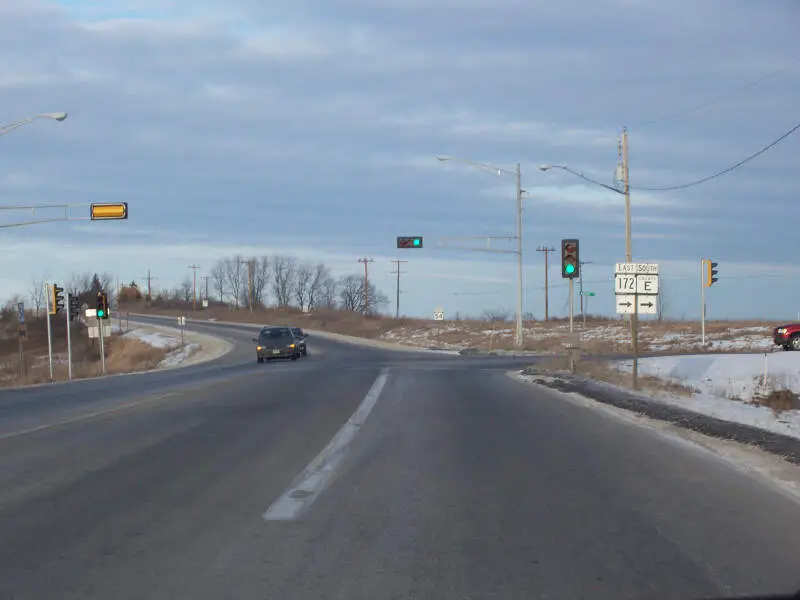
Hobart, WI Photos
Rankings & Articles For Hobart


Locations Around Hobart
Map Of Hobart, WI
Best Places Around Hobart
Allouez, WI
Population 13,975
Suamico, WI
Population 12,985
Suamico, WI
Population 12,985
De Pere, WI
Population 25,301
Kaukauna, WI
Population 17,706
Little Chute, WI
Population 11,754
Bellevue, WI
Population 16,442
Bellevue, WI
Population 16,442
Howard, WI
Population 21,087
Ashwaubenon, WI
Population 17,314
Hobart Demographics And Statistics
Population over time in Hobart
The current population in Hobart is 10,610. The population has increased 77.0% from 2010.
| Year | Population | % Change |
|---|---|---|
| 2024 | 10,610 | 1.8% |
| 2023 | 10,418 | 2.8% |
| 2022 | 10,130 | 2.6% |
| 2021 | 9,872 | 3.9% |
| 2020 | 9,499 | 4.9% |
| 2019 | 9,053 | 5.2% |
| 2018 | 8,606 | 5.2% |
| 2017 | 8,178 | 5.1% |
| 2016 | 7,779 | 5.8% |
| 2015 | 7,356 | 5.8% |
| 2014 | 6,951 | 5.7% |
| 2013 | 6,577 | 4.3% |
| 2012 | 6,307 | 3.6% |
| 2011 | 6,085 | 1.5% |
| 2010 | 5,993 | - |
Race / Ethnicity in Hobart
See the full breakdown
Hobart is:
77.6% White with 8,235 White residents.
0.1% African American with 15 African American residents.
5.2% American Indian with 551 American Indian residents.
1.8% Asian with 195 Asian residents.
0.2% Hawaiian with 23 Hawaiian residents.
2.7% Other with 282 Other residents.
6.3% Two Or More with 664 Two Or More residents.
6.1% Hispanic with 645 Hispanic residents.
| Race | Hobart | WI | USA |
|---|---|---|---|
| White | 77.6% | 78.6% | 57.4% |
| African American | 0.1% | 5.9% | 11.9% |
| American Indian | 5.2% | 0.5% | 0.5% |
| Asian | 1.8% | 2.9% | 5.9% |
| Hawaiian | 0.2% | 0.0% | 0.2% |
| Other | 2.7% | 0.3% | 0.6% |
| Two Or More | 6.3% | 3.7% | 4.3% |
| Hispanic | 6.1% | 8.0% | 19.3% |
Gender in Hobart
See the full breakdown
Hobart is 53.0% female with 5,626 female residents.
Hobart is 47.0% male with 4,984 male residents.
| Gender | Hobart | WI | USA |
|---|---|---|---|
| Female | 53.0% | 49.9% | 50.5% |
| Male | 47.0% | 50.1% | 49.5% |
Highest level of educational attainment in Hobart for adults over 25
See the full breakdown
3.0% of adults in Hobart completed < 9th grade.
3.0% of adults in Hobart completed 9-12th grade.
20.0% of adults in Hobart completed high school / ged.
16.0% of adults in Hobart completed some college.
9.0% of adults in Hobart completed associate's degree.
34.0% of adults in Hobart completed bachelor's degree.
13.0% of adults in Hobart completed master's degree.
1.0% of adults in Hobart completed professional degree.
1.0% of adults in Hobart completed doctorate degree.
| Education | Hobart | WI | USA |
|---|---|---|---|
| < 9th Grade | 3.0% | 4.0% | 4.0% |
| 9-12th Grade | 3.0% | 4.0% | 6.0% |
| High School / GED | 20.0% | 29.0% | 26.0% |
| Some College | 16.0% | 19.0% | 19.0% |
| Associate's Degree | 9.0% | 11.0% | 9.0% |
| Bachelor's Degree | 34.0% | 22.0% | 22.0% |
| Master's Degree | 13.0% | 8.0% | 10.0% |
| Professional Degree | 1.0% | 2.0% | 2.0% |
| Doctorate Degree | 1.0% | 1.0% | 2.0% |
Household Income For Hobart, Wisconsin
See the full breakdown
1.6% of households in Hobart earn Less than $10,000.
1.5% of households in Hobart earn $10,000 to $14,999.
1.8% of households in Hobart earn $15,000 to $24,999.
4.7% of households in Hobart earn $25,000 to $34,999.
9.4% of households in Hobart earn $35,000 to $49,999.
17.3% of households in Hobart earn $50,000 to $74,999.
12.2% of households in Hobart earn $75,000 to $99,999.
21.8% of households in Hobart earn $100,000 to $149,999.
13.9% of households in Hobart earn $150,000 to $199,999.
15.8% of households in Hobart earn $200,000 or more.
| Income | Hobart | WI | USA |
|---|---|---|---|
| Less than $10,000 | 1.6% | 4.1% | 5.0% |
| $10,000 to $14,999 | 1.5% | 3.0% | 3.4% |
| $15,000 to $24,999 | 1.8% | 5.9% | 6.3% |
| $25,000 to $34,999 | 4.7% | 7.2% | 6.6% |
| $35,000 to $49,999 | 9.4% | 10.8% | 10.1% |
| $50,000 to $74,999 | 17.3% | 17.5% | 15.5% |
| $75,000 to $99,999 | 12.2% | 13.8% | 12.6% |
| $100,000 to $149,999 | 21.8% | 19.1% | 17.5% |
| $150,000 to $199,999 | 13.9% | 9.4% | 9.6% |
| $200,000 or more | 15.8% | 9.2% | 13.4% |
Source: U.S. Census ACS 5-year estimates (2024)


